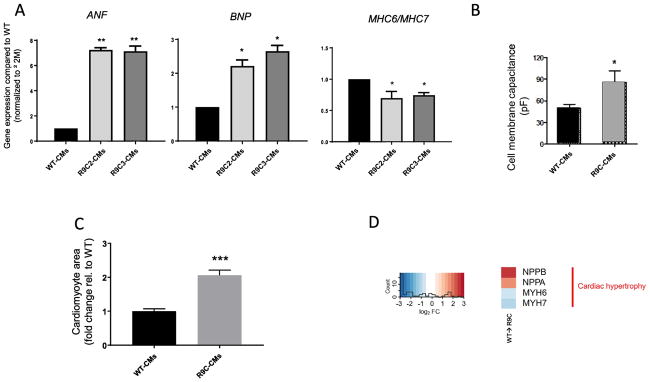
Figure 4.
R9C hiPSC-CMs exhibit a hypertrophic phenotype. (A) Quantitative PCR analysis of gene expression of cardiac hypertrophy markers ANF, BNP, MHC6 and MHC7 in isogenic CMs at day 35 (wild-type and R9C PLN). ANF and BNP gene expression were normalized to β2-microglobulin (β2M) housekeeping gene and shown as relative expression to wild-type hiPSC-CMs. MHC6 and MHC7 expression were normalized to β2M housekeeping gene and presented as MHC6/MHC7 ratio (N=3–5). (B) Cell membrane capacitance measurements of isogenic hiPSC-CMs (measure of cell size) (N=3). (C) Cardiomyocyte size of R9C hiPSC-CMs compared to isogenic wild-type controls. (D) Transcriptomic analysis of R9C hiPSC-CMs confirms hypertrophic phenotype (NPPA=ANF, NPPB=BNP, MYH6/7=MHC6/7).

