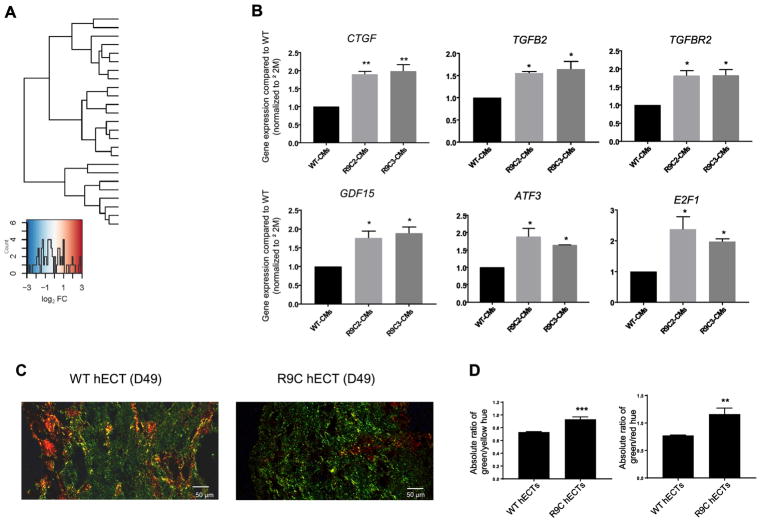
Figure 5.
Transcriptional response to R9C PLN of induced cardiomyocytes involves pro-fibrotic and altered metabolic phenotype. (A) Standardized expression of significant DEGs for R9C hiPSC-CMs compared to isogenic control. (B) Quantitative PCR analysis to confirm perturbed expression of profibrotic (TGFβ2 and TGFβR2) and proinflammatory (GDF15 and CTGF) cytokines, and transcription factors involved in fibrosis and cardiac stress (ATF3 and E2F1). (C) Human engineered cardiac tissues (hECTs) stained with picrosirius red, with images obtained by polarized light microscopy. Type I collagen appears as red and yellow fibers and type III collagen (fibrosis) appears green. (D) Quantification of fibrosis through analysis of different collagen types by their color purity (hue) in polarized light images, expressed as the absolute ratio of the mean green/yellow hue and green/red hue.

