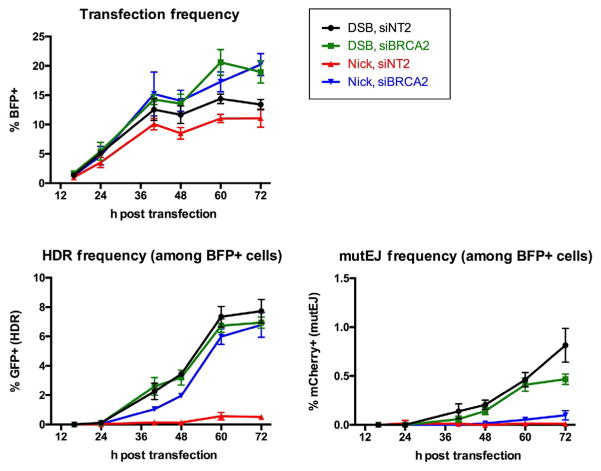
Fig. 3.
Time course of appearance of BFP+, GFP+, and mCherry+ TL cells. Above, representative example of frequency of BFP+ cells 0–72 h after transfection of Cas9-BFP (DSBs) and Cas9D10A-BFP (nicks) into 293T TL cells provided with a guide RNA expression plasmid and SSO donor for HDR. Below, frequency of GFP+ cells (HDR) and mCherry+ cells (mutEJ) among BFP+ transfectants.

