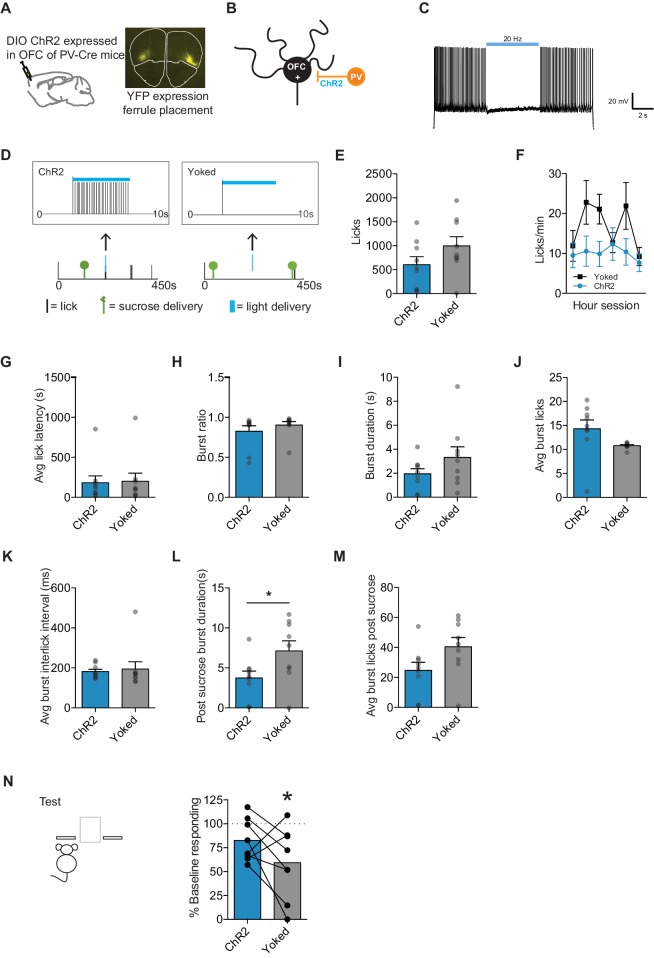
Figure 5. Optogenetic inhibition of OFC projection neurons during sucrose consumption prevents value updating.
(A) Schematic of injection site and ferrule implant (top), with DIO ChR2-eYFP detected at OFC injection site (bottom). (B) Schematic of setup of OFC excitatory neuron (OFC +) inhibition by activation of Parvalbumin (PV) interneurons (C) Confirmation of ChR2 function using ex vivo whole-cell recording. (D) Closed-loop behavioral control over light delivery. Example where in the ChR2 group the first lick after a sucrose delivery resulted in a 5 s light delivery (5 ms pulse, 20 Hz) (left), while Yoked group received light delivery at the same time independent of licking behavior (right). Group n’s: ChR2: n = 8, Yoked: n = 8. (E) Number of licks and (F) licking rate (10 min bins) during the re-exposure session. (G) The average latency to begin licking after a sucrose delivery (s). (H) The ratio of licks that occur in bursts, (I) average duration of bursts (ms), (J) average number of licks within a burst, and (K) average interlick interval within bursts (ms). (L) Average burst duration after a sucrose delivery (s) and (M) average number of licks within a burst after a sucrose delivery. (N) Response rate during the 5 min non-rewarded test as a percent of acquisition response rate (last 2 days of training). Data points and bar graphs represent the mean ± SEM. * indicates p<0.05.

