. 2018 Jul 10;7:e35449. doi: 10.7554/eLife.35449

Figure 4. Emergence of a new stem cell class, ε, in juveniles.

(A–B) Distributions of EdU+ cells in three-week-old juveniles. Note the high density of EdU+ cells toward the posterior of the worms. (B) More mature males with partly developed lateral body extensions and females with a visible uterus display EdU+ cells in primordial gonads and the posterior growth zone (PGZ). (C) Hierarchical clustering of 85 juvenile stem cells distinguishes two major cell classes. Gene names in blue: cell class-dependent genes identified in the sporocyst stem cells; gene names in grey: top genes upregulated in juvenile stem cells compared to sporocyst stem cells. Expression levels were standardized gene-by-gene by mean-centering and dividing by the standard deviation of expressing cells. (D) Domain diagram of Eled, predicted by TMHMM 2.0 (Krogh et al., 2001). TM: transmembrane domain. S/T rich domain: extracellular domain enriched in serine/threonine.

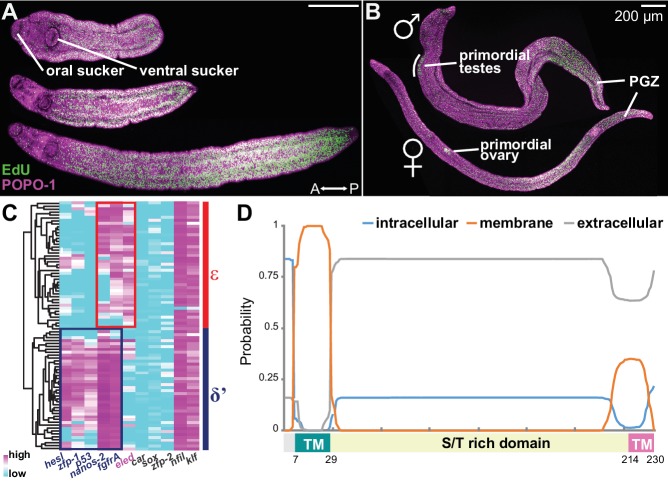
Figure 4.

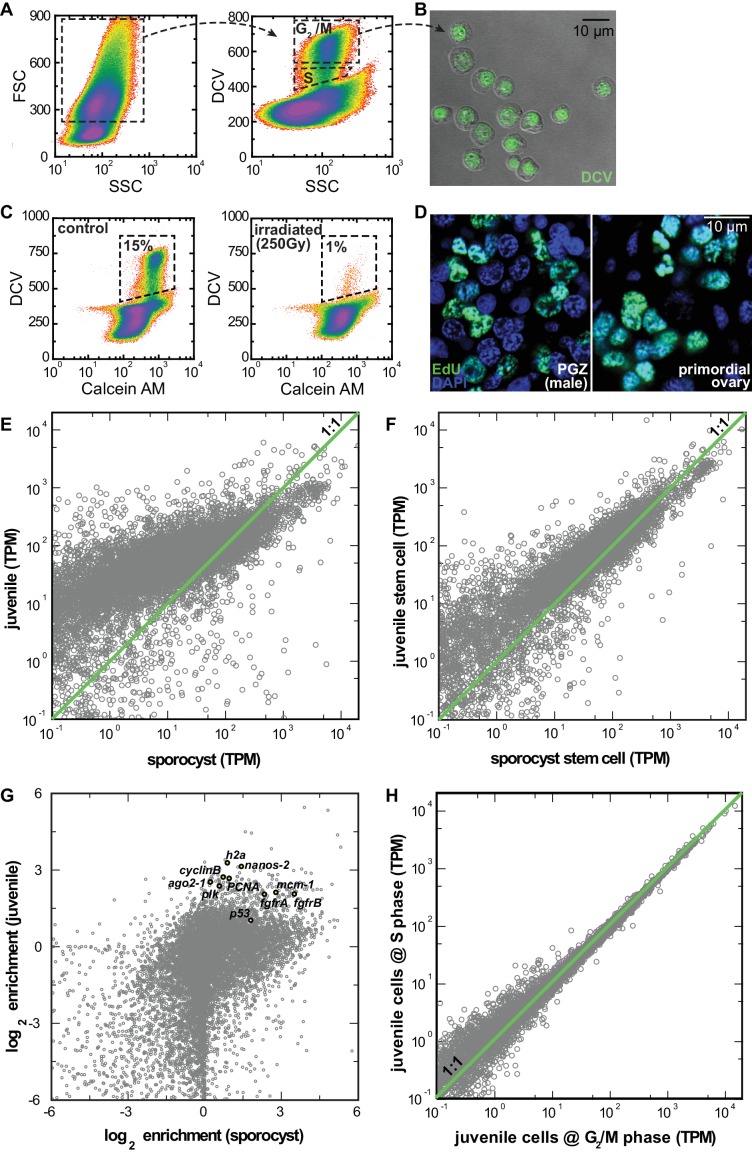
Figure 4—figure supplement 1. RNAseq comparison of FACS-isolated proliferating cells from sporocysts and juveniles.

Figure 4—figure supplement 1.

(A) Dissociated cells were gated using FSC, SSC, and DCV fluorescence to isolate S or G2/M phase cells from juveniles. Dead cells and debris (<30% of total events) were pre-excluded based on high TOTO-3 fluorescence. (B) Sorted G2/M phase cells from juveniles visualized by DIC and fluorescence microscopy. (C) Proliferating cells in juveniles are irradiation-sensitive. Calcein AM fluorescence measures cytoplasmic content. Percentages are normalized to total number of live cell events. (D) Single confocal sections to show similar nuclear morphology of EdU+ cells in soma (left) and primordial gonads (right) in juvenile worms. (E) Comparison of expression levels in log space for all genes encoded by the S. mansoni genome (n = 10,765) between juveniles and sporocysts. (F) Comparisons of expression levels in log space for all transcripts (n = 10,765) between sorted G2/M cells from juveniles vs. mother sporocysts. (G) Comparison of enrichment in stem cells in log space for all genes between juveniles and sporocysts. Previously characterized stem cell genes in Wang et al. (2013) are highlighted. All these genes are enriched in the sorted cell populations. (H) Comparisons of expression levels in log space for all transcripts between juvenile cells at S phase vs. G2/M phase. This result suggests that cell-cycle status is unlikely to contribute to the observed cell heterogeneity. Although our single-cell analyses rely exclusively on the G2/M phase cells, at the population level, G2/M and S phase cells are largely transcriptionally identical. This conclusion is surprising but consistent with the previous single-cell analyses of proliferating stem cells in schistosome’s free-living cousin, the planarian (van Wolfswinkel et al., 2014).
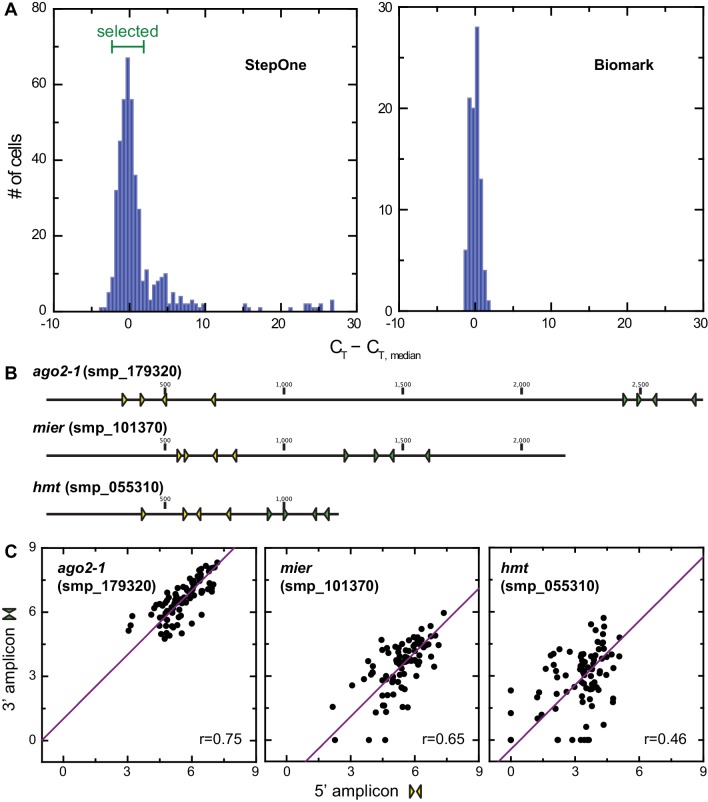
Figure 4—figure supplement 2. Analysis of technical variation of single-cell qPCR.

Figure 4—figure supplement 2.

(A) Histogram showing variations in CT values corresponding to h2a levels from individual juvenile stem cells on StepOne Real-time PCR platform. 4 CT around the plate median were selected for multiplex qPCR on the Fluidigm Biomark platform, which showed similar variations in h2a level. (B) Positions of nested primer sets on ago2-1, mier, and hmt coding sequences, three genes that cover the full dynamic range in gene expression levels. Two sets of primers were measured simultaneously for each of the three genes to estimate technical noise. (C) Single-cell qPCR determined expression levels of ago2-1, mier, and hmt based on two amplicons show linear relations. The spread from linear relations quantifies the technical uncertainty in this method. Technical noise was determined as 2 ~3 CT and inversely proportional to gene expression level.
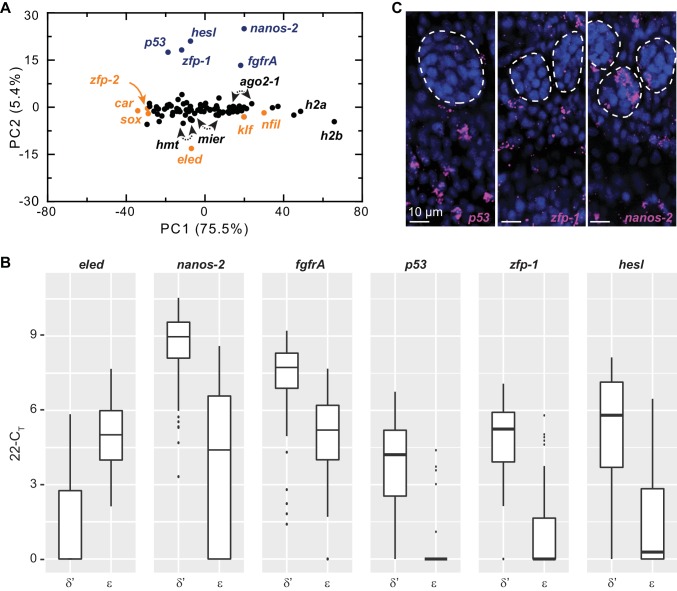
Figure 4—figure supplement 3. Single-cell qPCR identifies ε-cells in juveniles.

Figure 4—figure supplement 3.

(A) PCA of the single-cell qPCR results revealed that most assayed genes extended along PC1, which appears to scale with average expression levels among cells. The top class-specific markers in sporocyst stem cells, including nanos-2, fgfrA, p53, zfp-1, and hesl were opposed on PC2 by eled. Although eled is undetectable in sporocyst stem cells but is among the most abundant transcripts in juvenile stem cells, cellular heterogeneity was not dominated by differences between sporocyst and juvenile stem cells, since all other top genes in this category (i.e. genes upregulated in juvenile vs. sporocyst stem cells, orange) had small loadings on PC2. Blue: cell class-dependent genes identified in the sporocyst stem cells; arrowheads: ago2-1, mier, and hmt are represented by two independent primer sets. (B) Box plots of expression levels of selected class-dependent genes. Boxes indicate quartiles and medians, whiskers show maxima and minima, and dots represent outliers (above and below 1.5X interquartile range). For all genes, the difference is statistically significant (p<10−4, t-test). Note that the limit of detection of the single-cell qPCR experiments was determined as 22 CT; undetected genes or CT values greater than 22 were all adjusted to 22. Expression values in log space were calculated as 22-CT. The technical noise was determined as 2–3 CT. (C) Confocal sections of FISH to detect p53, zfp-1, and nanos-2. Dashed circles: testes lobes. p53 and zfp-1, are only expressed in δ’-cells and excluded from primordial gonads, whereas nanos-2 is expressed in both soma and a subset of germ cells.
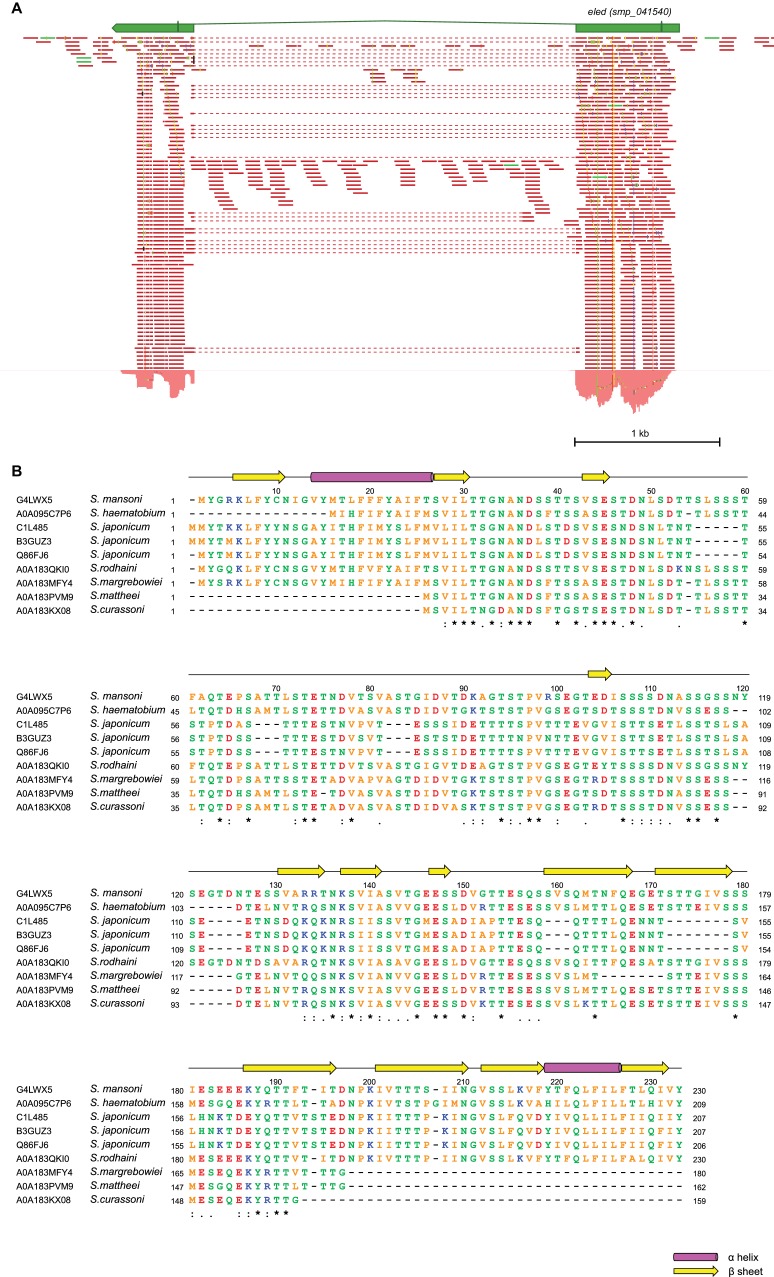
Figure 4—figure supplement 4. eled gene structure.

Figure 4—figure supplement 4.

(A) RNAseq read mapping confirms the annotation of eled (Smp_041540). Exons are shown as green boxes connected by introns (lines). Start and stop codon are also specified. Reads that bridge the two exons are shown by dotted lines. Total RNA was extracted from juvenile worms. (B) Sequence alignment of eled homologs from various schistosome species. Alignment was generated by ClustalOmega (Li et al., 2015) using sequences of Uniprot IDs specified in the figure. Secondary structural elements are predicted by PSIPRED server based on S. mansoni sequence (Buchan et al., 2013). Identical, very similar, and similar amino acids are indicated by ‘*’, ‘:’, and ‘.’, respectively. Colors represent residues with different properties. Orange: A, V, F, P, M, I, L, W; red: D, E; blue: R, K; green: S, T, Y, H, C, N, G, Q.