
Figure 3. Multitemperature crystallography of apo PTP1B recapitulates an allosteric mechanism.
(A) In apo PTP1B, the occupancy of the α7 helix decreases (i.e. the helix becomes more disordered) with temperature. The helix was modeled with one conformation and its occupancy was refined; the remaining occupancy corresponds to the disordered state of the helix. (B) Several residues that allosterically link α7 and the active-site WPD loop also undergo shifts with temperature. (C) These additional conformations match the state trapped by the allosteric inhibitor BB2 (PDB 1t49) (Wiesmann et al., 2004) which binds >12 Å away from the active site. The viewing orientation in (B–C) is as in Figure 1A (‘front side’ of PTP1B), except slightly zoomed in.
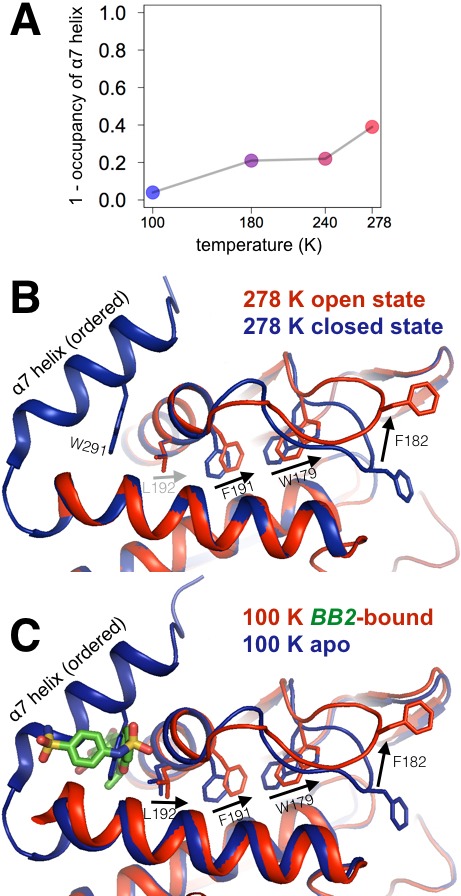
Figure 3—figure supplement 1. Alternative conformations in apo PTP1B recapitulate a reported conformational switching mechanism in the active site during WPD loop closing.
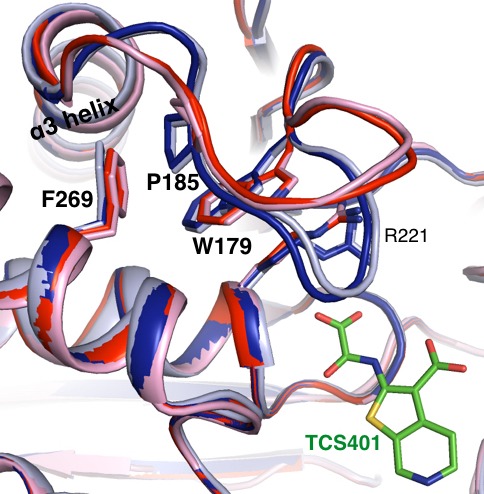
Alternative conformations in our 278 K apo structure corresponding to the open state (red) vs. closed state (dark blue) recapitulate conformational changes for several residues (labeled) in the active site that undergo a CH/π-mediated switch between the open state (pink, 5k9v) and TCS401-inhibitor-bound closed state (light blue, 5k9w) (Choy et al., 2017). The viewing orientation is as in Figure 1A (‘front side’ of PTP1B), except zoomed in on the active site (labeled in Figure 1A).
Figure 3—figure supplement 2. Allosteric inhibitor binding quenches conformational heterogeneity regardless of temperature.
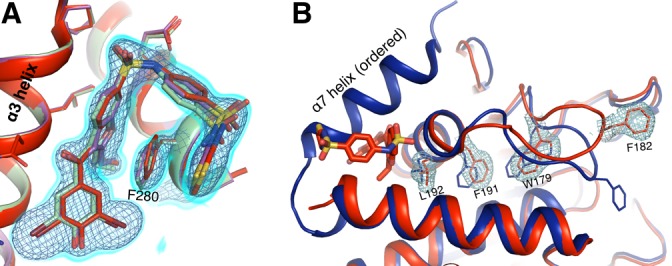
(A) The pose of BB3 in our new 1.80 Å 273 K structure (red) is well-justified by 2Fo-Fc electron density contoured at 0.75 σ (cyan volume) and at 1.5 σ (blue mesh). The pose is also essentially identical to the poses in previously published 100 K structures with BB3 (1t4j, magenta) and BB2 (1t49, pale green), which is very similar in structure and inhibition to BB3 (Wiesmann et al., 2004). (B) 2Fo-Fc electron density contoured at 0.75 σ (cyan) supports only a single conformation along the previously characterized allosteric pathway, rather than the multiple conformations seen at 278 K from our multitemperature apo PTP1B series (Figure 3); a 100 K structure in the closed state (1sug, blue) is shown for comparison. This confirms that inhibitor binding quenches conformational heterogeneity essentially completely, locking the protein in the open state. The viewing orientation in A) is as in Figure 1B (‘back side’ of PTP1B), except zoomed in on the BB site (labeled in Figure 1B). The viewing orientation in B) is as in Figure 1A (‘front side’ of PTP1B), except slightly zoomed in.
Figure 3—figure supplement 3. Allosteric-inhibitor-bound PTP1B has some low-occupancy conformations only at 273 K.

(A) At 273 K, despite a good fit to 2Fo-Fc electron density, shown contoured at 0.75 σ (cyan volume), the allosteric inhibitor BB3 cannot be sufficiently modeled with a single conformer, as evidenced by +3.5 σ (green mesh) and −3.5 σ (red mesh) Fo-Fc difference electron density. These features are absent from the 100 K structure with BB3 (1t4j). (B) These unexplained difference features disappear when a second alternate conformer is added with a translation at the ‘bottom’ of the molecule (from this viewing angle) and dihedral-angle changes at the ‘top right’. (C) The disordered α7 helix is reordered above the BB binding site in various structures: 273 K with BB3 (pink; BB3 molecule in green), 100 K with BB1 (pale blue, PDB ID 1t48), 100 K with the S295F mutation (orange, PDB ID 2f6f), and 100 K with the L192A mutation and the TCS-401 active-site inhibitor (yellow, PDB ID 5ka9). The normal ordered α7 conformation (blue, PDB ID 1sug) is shown for reference. See Figure 7A for another example of a reordered α7 conformation. (D–G) Evidence for some of the conformations in C. (D) At 273 K, 2Fo-Fc electron density contoured at 1.0 σ (cyan volume) and Fo-Fc difference electron density contoured at +3.5 σ (green mesh) and −3.5 σ (red mesh) suggest something remains unmodeled above the bound BB3 molecule. (E) Modeling a reordered portion of the disordered α7 helix, including Trp291 (pink), fits the 2Fo-Fc density, removes the positive Fo-Fc peaks, and has reasonable interactions with nearby sidechains on α3 (left). (F–G) At 100 K, the electron density (shown at the same contour levels) suggests a different reordered conformation of α7 above BB1 (PDB ID 1t48). Both reordered α7 conformations (D–E) vs. (F–G) place residues 290–292, including Trp291, in the same place. However, the C-terminal portion of the reordered conformation with BB1 at 100 K, including His296 (right), is sterically incompatible with the N-terminal portion of the α6-α7 junction with BB3 at 278 K, including Ser286. Neither conformation is compatible with the electron density for the other, suggesting that differences in temperature and/or inhibitor dictate different α7 conformations. The viewing orientation in C–G) is as in Figure 1B (‘back side’ of PTP1B), except zoomed in on the BB site (labeled in Figure 1B).