. 2018 Jun 7;7:e36307. doi: 10.7554/eLife.36307

Figure 5. Coupled conformational heterogeneity leads to the allosteric 197 site.

(A) Several residues distinct from both the active site and a previously characterized allosteric network each have minor alternative conformations that become more populated with temperature. This is quantified by the sum of 2Fo-Fc electron density values for the centers of atoms that are unique to the minor state (defined as being at least 1.0 Å away from any atoms in the major state), normalized across temperatures from 0 to 1 for each residue. (B) These residues colocalize to a region of the protein surrounded by loop 11 (top-left), the quasi-ordered α7 helix (top-right), and the α3 helix (right), including the eponymous K197. 2Fo-Fc electron density contoured at 0.6 σ (cyan volume) and at 0.8 σ (blue mesh) justify multiple conformations for these residues in our 278 K apo model, as quantified in (A). The alternative conformations of these residues appear to interact with one another and thus may be allosterically coupled. Ordered crystallization mother liquor or cryoprotectant molecules (glycerols in pink, from the PDB and our structures, or MPD molecules in green, from the PDB) can be present at the terminus of this allosteric pathway, suggesting it may be amenable to binding other small molecules. The viewing orientation in B) is as in Figure 1B (‘back side’ of PTP1B), except zoomed in on the 197 site (labeled in Figure 1B).

Figure 5.

Figure 5—figure supplement 1. Alternative conformations in apo PTP1B recapitulate and expand upon reported coupling between loop 11 and α3.

Figure 5—figure supplement 1.

(A) Structures of the apo open state (yellow, 5k9v) and the closed state with the active-site inhibitor TCS401 (pink, 5k9w) (Choy et al., 2017) feature coupled movements of the loop 11 backbone, including Tyr152, and Asn193 within α7. (B–D) In our 278 K apo structure, we also observe coupling between these residues. However, Tyr152 is best fit with a ‘down’ plus an ‘up’ rotamer as alternative conformations for the open-state backbone, and only a down rotamer for the closed-state backbone. This is borne out by 2Fo-Fc electron density contoured at 0.3 σ (cyan volume) and Fo-Fc electron density contoured at +2.8 σ (green mesh) and −2.8 σ (red mesh) after refinement with either the down rotamer (C) or the up rotamer (D) omitted. A partial-occupancy water that is mutually exclusive with the up rotamer is also present (transparent red sphere). Note: Asn193 may also adopt another low-occupancy rotamer. (E) The down Tyr152 rotamer in the WPD-closed-compatible L11 backbone conformation (red) would sterically clash (pink pillows) with Thr178 in the open state of the WPD loop (orange). Both Tyr152 rotamers in the WPD-open state (orange) would sterically clash with the ordered conformation of the α7 helix (red). The viewing orientation in all panels is as in Figure 1B (‘back side’ of PTP1B), except zoomed in on loop 11, the α3 helix, and the α7 helix (labeled in Figure 1B).
Figure 5—figure supplement 2. The allosteric 197 site has local sequence differences in related PTPs.

Figure 5—figure supplement 2.

Several amino acids in the allosteric 197 site in PTP1B (gray) are different at the equivalent positions in the closest homolog, TCPTP (orange). The viewing orientation is as in Figure 1B (‘back side’ of PTP1B), except zoomed in on the 197 site (labeled in Figure 1B).
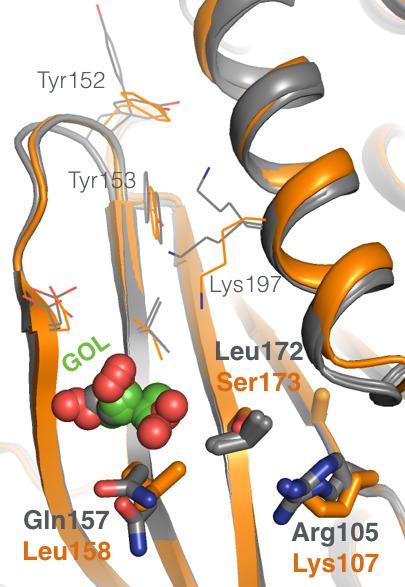
Figure 5—figure supplement 3. Mutations along the 197 site’s allosteric pathway reduce enzyme activity.

Figure 5—figure supplement 3.

(A) Point mutations to several residues along the allosteric pathway from the allosteric 197 site to the active site reduce activity to varying degrees. Data represent the mean of four independent assays ± standard deviation. (B) Michaelis-Menten kinetics for WT* vs. allosteric point mutants ± the standard error of the mean. See Materials and methods for details.
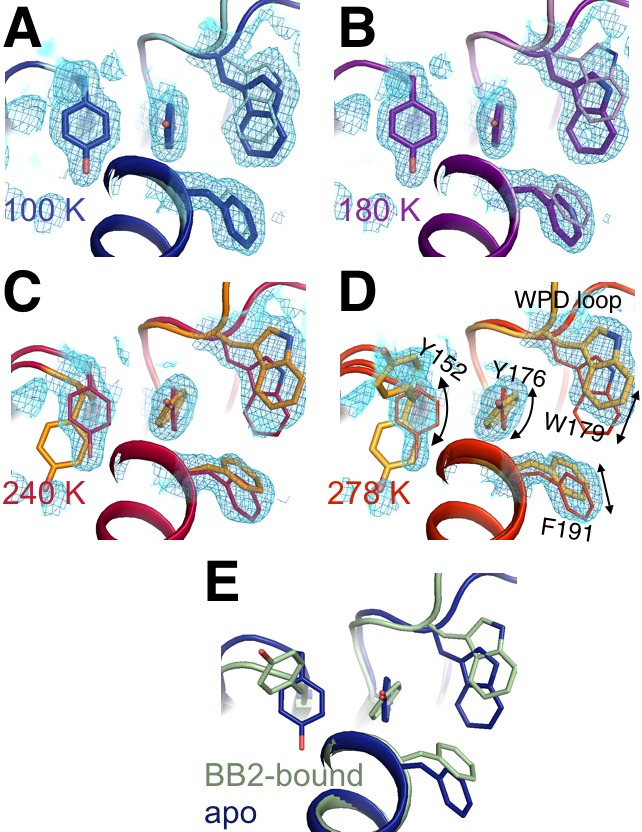
Figure 5—figure supplement 4. Flexible aromatic residues complete an allosteric circuit.

Figure 5—figure supplement 4.

Conformational heterogeneity for Tyr176 links Tyr152 in the allosteric 197 site to Phe191 in the previously reported allosteric pathway (Wiesmann et al., 2004) and Trp179 in the WPD loop, thus completing an allosteric circuit. (A-D) In apo PTP1B, 2Fo-Fc electron density contoured at 0.8 σ (cyan volume) and at 0.8 σ (blue mesh) generally justifies a single conformation these aromatic residues at low temperatures, but multiple conformations at high temperatures -- especially for Tyr176 and Tyr152. (E) These individual conformations are evident in the previously published 100 K apo (blue, 1sug) or BB2-bound (green, 1t49) structures, respectively. The viewing orientation in all panels is as in Figure 1B (‘back side’ of PTP1B), except looking down from the top of that image into the core of the protein.
Figure 5—video 1. Movie version of Figure 5B.
Download video file (2.2MB, mp4)
DOI: 10.7554/eLife.36307.023