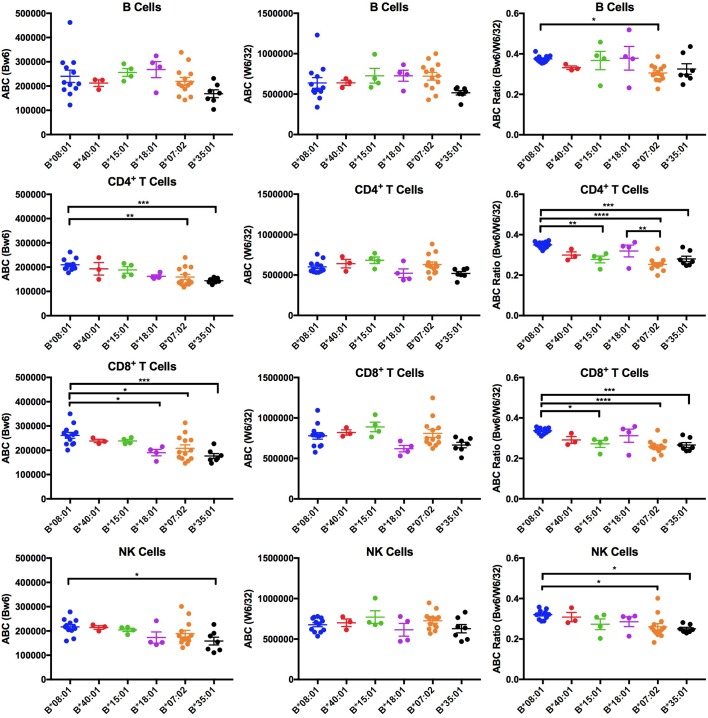
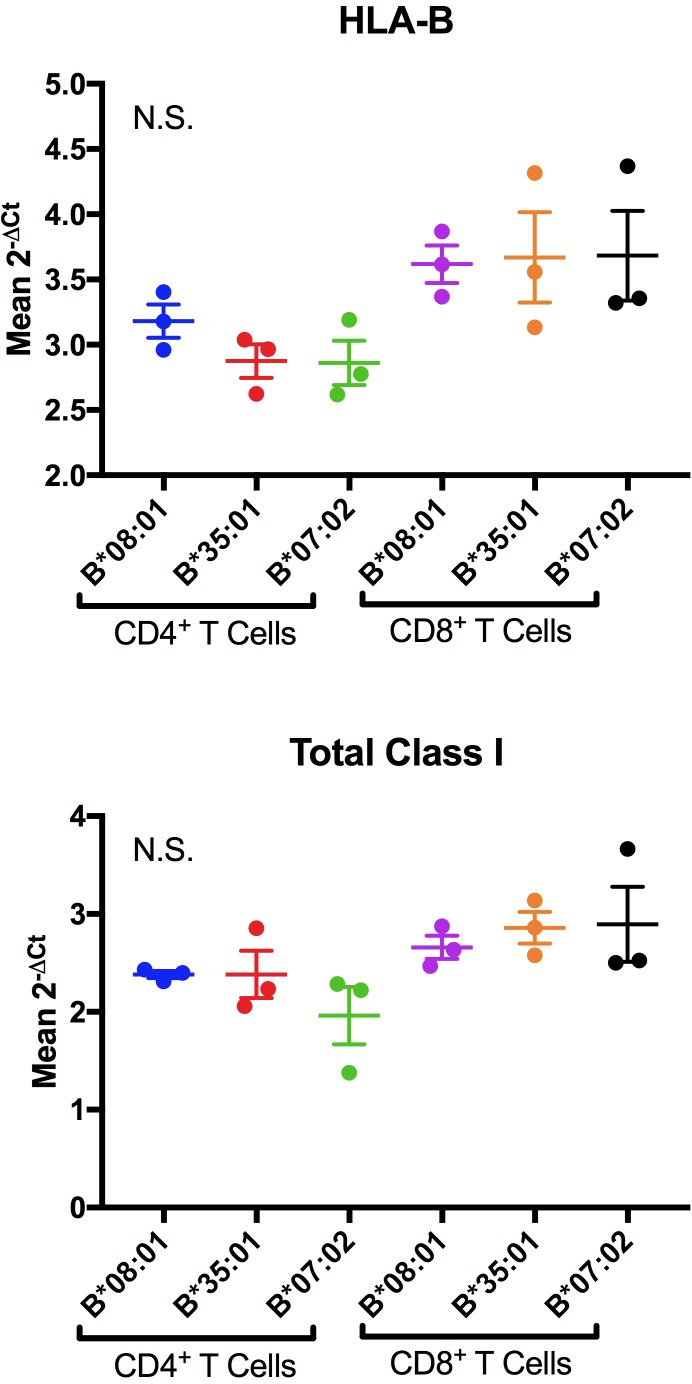
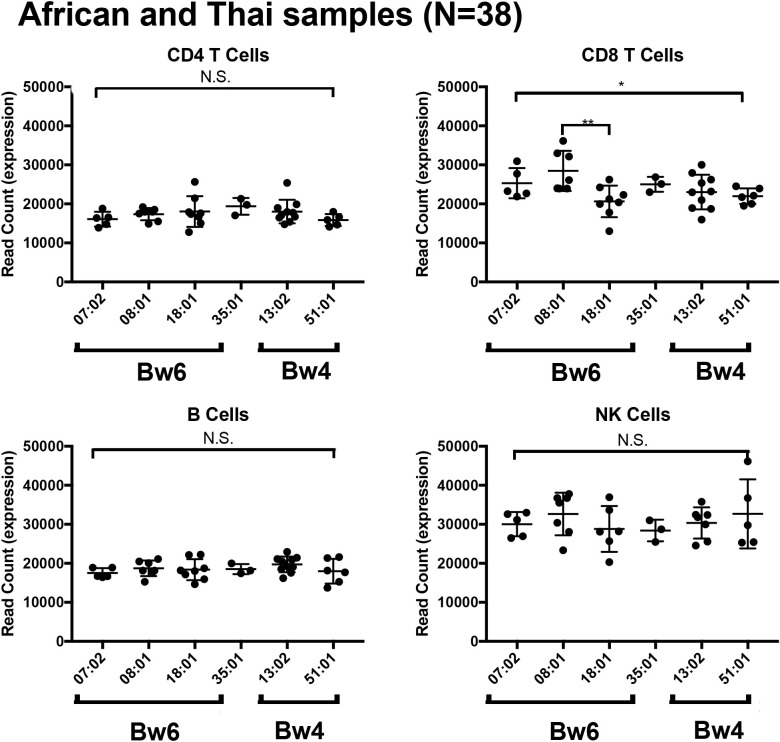
Figure 1. Expression variations among HLA-Bw6 alleles.
Forty-three healthy donors (Figure 1—source data 1) with either heterozygosity for HLA-Bw4/Bw6 or homozygosity for HLA-Bw6 alleles were sorted into six groups based on their Bw6 alleles. ABC values were calculated by flow cytometry based on staining freshly isolated PBMCs with anti-Bw6 or W6/32 and normalizing the resulting geometric MFI values against beads with known amounts of Fc receptors. Averaged ABC values for each donor are shown, grouped by the donor’s HLA-Bw6 alleles and lymphocyte subset analyzed (B cells (top row), CD4+ T cells (second row), CD8+ T cells (third row), and NK cells (last row)). For homozygous donors, 50% of the derived ABC values are plotted. Bw6 ABC values alone (column 1), W6/32 ABC values alone, (column 2) and the Bw6/W6/32 ABC ratios (column 3) are shown. The number of replicate measurements for each donor and standard errors of the mean are shown in Figure 1—source data 1. Statistically significant differences between alleles were analyzed by one-way ANOVA analysis for each cell type. Each dot represents averaged Bw6, W6/32, or Bw6/W6/32 ABC measurements (n > 3) from a single donor. p *<0.05; **<0.01; ***<0.001; ****<0.0001. This figure has five supplementary figures and one source data table.

