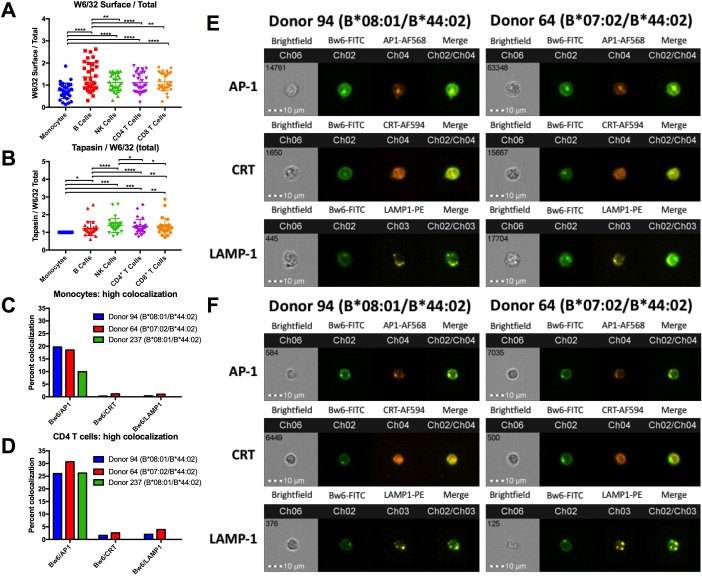
Figure 4. HLA class I assembly differences between monocytes and lymphocytes.
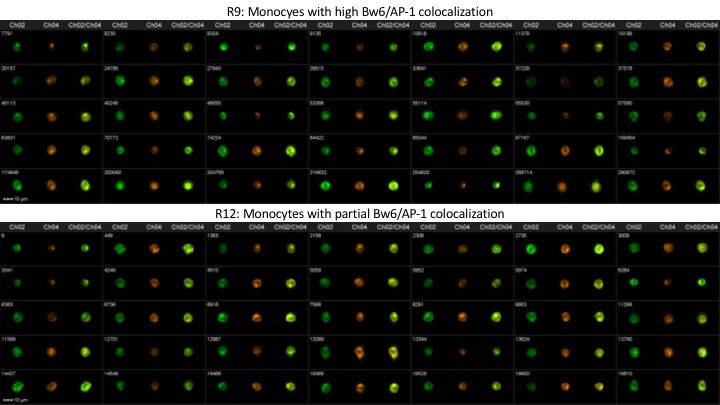
A: Flow cytometry experiments measuring W6/32-based staining of cell surface HLA class I (fixed PBMCs) expressed as a ratio relative to W6/32-based staining of total HLA class I (fixed and permeabilized PBMCs). Each point represents an individual donor measurement, and a total of 33 donor samples were tested. B: PBMCs were fixed and permeabilized, then stained with either anti-tapasin or W6/32 antibodies. The ratio of tapasin MFI relative to the W6/32 MFI was calculated for each cell type, then normalized to the corresponding monocyte ratios. Each point represents an individual donor measurement, and a total of 29 donor samples were tested. C and D: Summary statistics from two ImageStream experiments with three donors in monocytes (C) or CD4+ T cells (D). Bw6 and AP-1 co-localization, Bw6 and CRT co-localization, and Bw6 and LAMP-1 co-localization were quantified for donors 94 and 64. Only Bw6 and AP-1 co-localization was measured for donor 237. E and F: Representative monocyte (E) or CD4+ T cell (F) images for the experiments summarized in Panels C and D. This figure has five supplementary figures and one source data table.
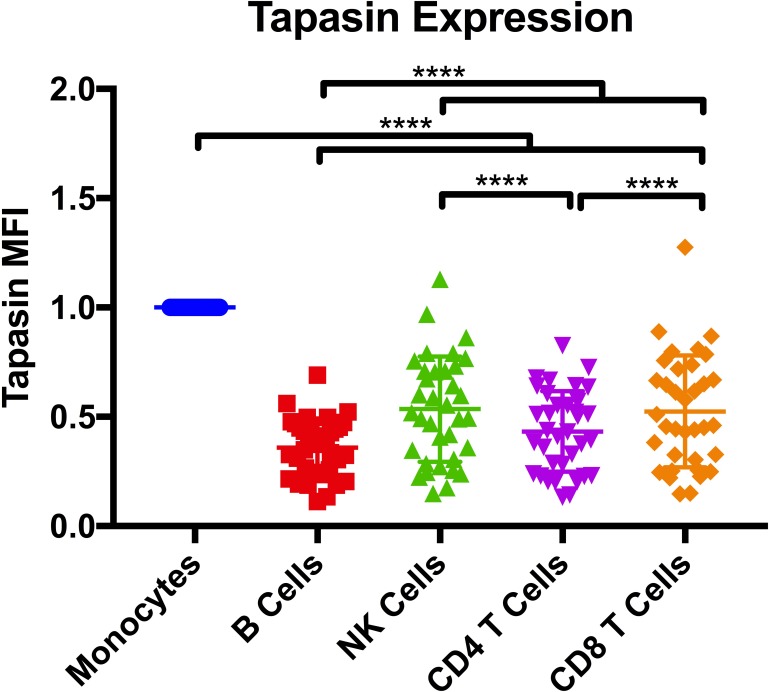
Figure 4—figure supplement 1. Tapasin expression.
Figure 4—figure supplement 2. Gating strategy for imaging cytometry experiments.
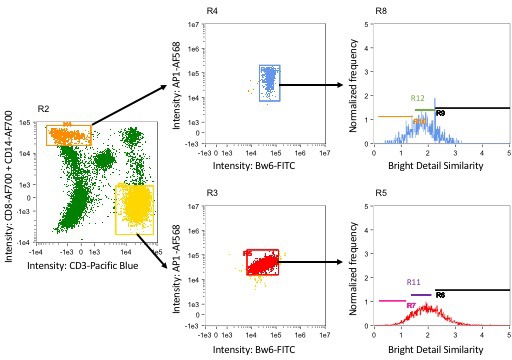
Figure 4—figure supplement 3. Representative image gallery for Donor 64 monocytes.
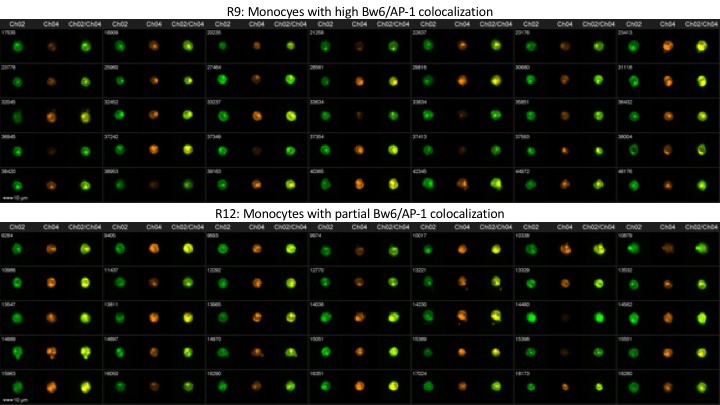
Figure 4—figure supplement 4. Representative image gallery for Donor 94 monocytes.
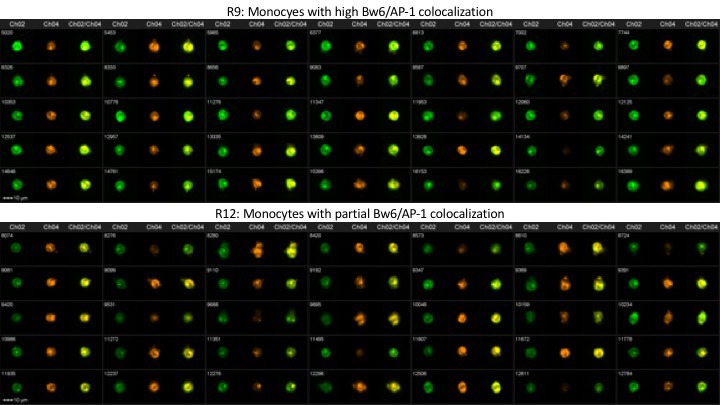
Figure 4—figure supplement 5. Representative image gallery for Donor 237 monocytes.
