. 2018 Jul 10;7:e34961. doi: 10.7554/eLife.34961

Figure 8. Peptidome and peptide-binding characteristics of HLA-B.

Shannon entropy plots of B lymphoblastic cell-derived 9-mer peptides for the indicated allotypes, based on mass spectrometry datasets obtained from (Pearson et al., 2016). Plots are based on 9-mer peptides assigned to each allele based on IEDB predictions (iedb.org). n values represent the total number of independent datasets used for the plots. x values represent the number of peptides in the independent datasets used for the plots. This figure has two supplementary figures.

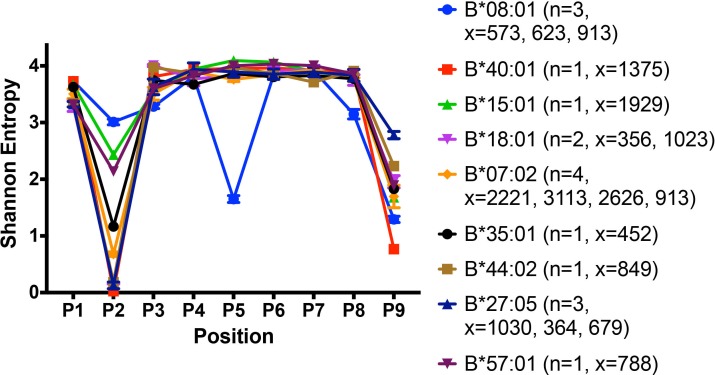
Figure 8.

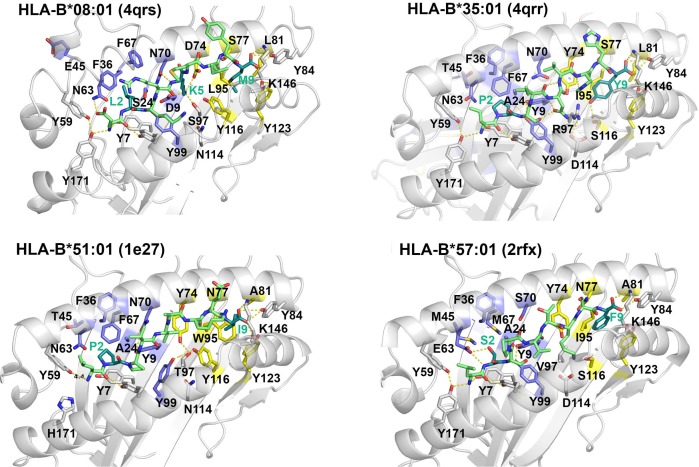
Figure 8—figure supplement 1. Crystal structures of HLA-B allotypes illustrate that the D9 polymorphism of B*08:01, absent among other HLA-B allotypes, accounts for the unique P5 amino acid anchor of B*08:01.

Figure 8—figure supplement 1.

Residues highlighted blue on the heavy chain interact with the peptide at P2, whereas residues highlighted yellow on the heavy chain interact with the peptide at PC. Protein data bank (PDB) numbers corresponding to each structure are indicated.
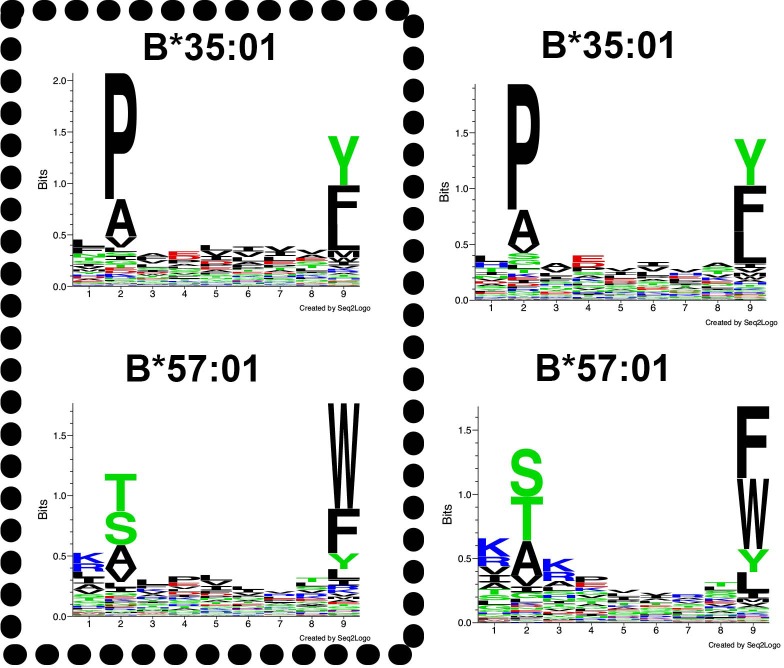
Figure 8—figure supplement 2. Peptide-binding motifs of B*35:01 compared to HLA-B*57:01.

Figure 8—figure supplement 2.

Peptides were analyzed using seq2logo: http://www.cbs.dtu.dk/biotools/Seq2Logo/ (Thomsen and Nielsen, 2012). Peptides for the boxed alleles (left panels) were derived from a published dataset based on the immunoaffinity method (Abelin et al., 2017) and peptides for the right panel were obtained from a published dataset based on acid elution of cells and epitope predictions (Pearson et al., 2016).