
Figure 2.
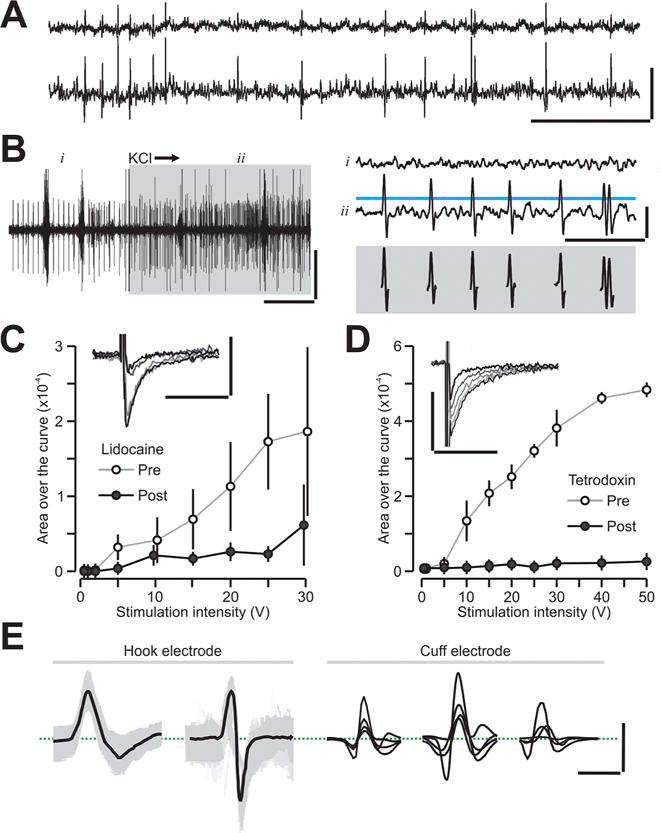
Recording compound action potentials in the vagus nerve. (A) Simultaneous recordings (two of three electrodes are shown) of spontaneous activity in the vagus nerve. (B) (Left) Vagus nerve excitation by KCl (4 mM, gray box) applied to the surgical field. (Top right) Period of quiescent activity before KCl (marked by i). (Middle) Period of intense spiking during KCl (marked by ii). Blue line indicates the adaptive threshold used to detect compound action potentials (CAPs). (Bottom) Isolated CAPs are aligned with the trace above. (C) (Inset) Brief electrical pulses stimulate the vagus nerve and produce evoked CAPs. The graph shows the CAP area (mean ± SD), which becomes larger with increasing stimulation intensity (pre circles). Lidocaine (2%) largely blocks the evoked CAPs (post circles). (D) (Inset) Evoked CAPs previous to treatment with tetrodotoxin (100 μM). The graph shows the CAP area (mean ± SD), which is completely blocked by the drug. (E) Representative firing of single unit fibers obtained with hook and cuff electrodes. Scale bars (x, y), A, 100 ms, 100 μV; B left, 1 sec, 20 μV; B right, 10 ms, 20 μV; C, D, 2 ms, 40 μV; E, 2 ms. 10 μV.