
Figure 3.
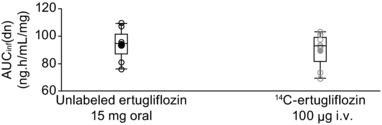
Individual and geometric mean dose‐normalized area under the plasma concentration‐time curve extrapolated to infinity (AUCinf(dn)) values for unlabeled ertugliflozin and 14C‐ertugliflozin. Circles represent individual values and dots represent geometric means. Box plot provides median and 25%/75% quartiles with whiskers to the last point within 1.5 × interquartile range.