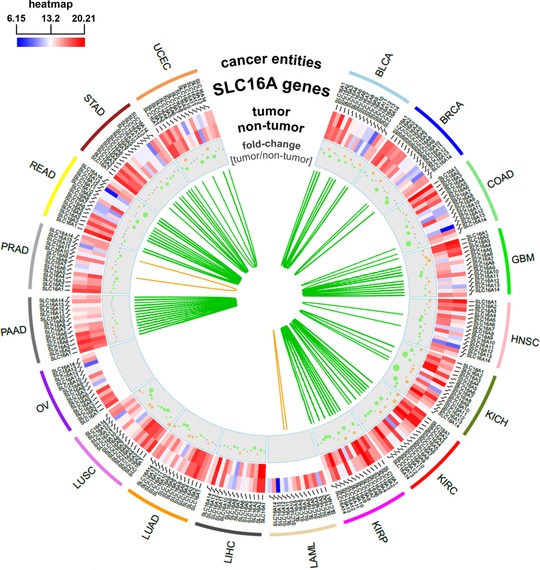
Figure 4.

Differential gene expression of monocarboxylate transporter (MCT) isoforms in different cancer entities of The Cancer Genome Atlas (TCGA). The circos plot shows a heat‐map of gene expression of the individual members of the solute carrier (SLC)16 gene family in different cancer entities in tumors and corresponding normal tissues using gene expression data from TCGA (http://cancergenome.nih.gov/). Furthermore, fold‐changes (log2) of expression levels in tumors compared with normal tissues are represented by grey, orange, or green dots (grey: comparable expression levels in tumors and normal tissues; orange: higher expression in tumors; and green: higher expression in normal tissues). The size of the dots depends on the absolute value of fold‐changes (log2). The green and orange lines depict Spearman correlation coefficients (rS > 0.7) between individual SLC16 isoforms in normal (green) and tumor (orange) tissue. BLCA, bladder cancer; BRCA, breast cancer; COAD, colon cancer; GBM, glioblastoma; HNSC, head and neck cancer; KICH, kidney chromophobe; KIRC, kidney clear cell carcinoma; KIRP, kidney papillary carcinoma; LAML, acute myeloid leukemia; LIHC, liver cancer; LUAD, lung adenocarcinoma; LUSC, lung squamous cell carcinoma; OV, ovarian cancer; PAAD, pancreatic cancer; PRAD, prostate cancer; READ, rectal cancer; STAD, stomach cancer; UCEC, endometrioid cancer.
