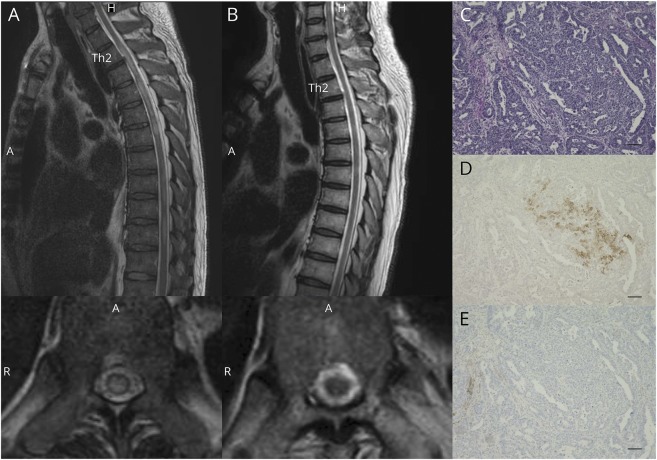
Figure. Long cord lesions in spine MRI and aquaporin 4 (AQP4) immunoreactivity in adenocarcinoma cells.
(A) Sagittal and axial (Th10 level) T2-weighted images of the spine at disease onset. T2-increased signals were observed in the thoracic spinal cord. (B) Sagittal and axial (Th10 level) T2-weighted images of the spine 1 year after the onset. (C–E) Pathologic analysis of the adenocarcinoma at the esophagogastric junction (C: hematoxylin and eosin, D: AQP-4 immunoreactivity [brown], and E: programmed cell death ligand 1 immunoreactivity [brown]). Scale bars indicate 100 μm.

