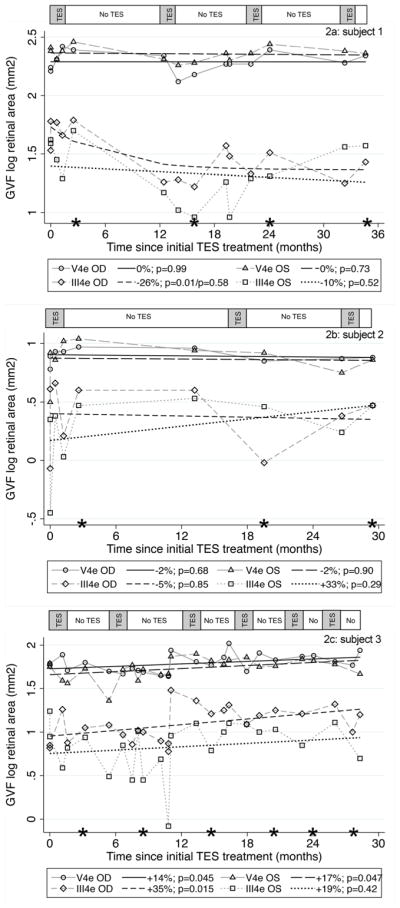
Fig. 2.

Panels 2a, 2b, and 2c show the GVF log retinal areas over time for subjects 1, 2, and 3, respectively. The asterisks along the x-axis indicate the assessment that occurred four to 7 weeks after completion of each TES treatment course of six weekly sessions. The bar along the top of each figure panel indicates the periods during which TES was administered (gray shaded areas) and when no TES was administered (white areas)
