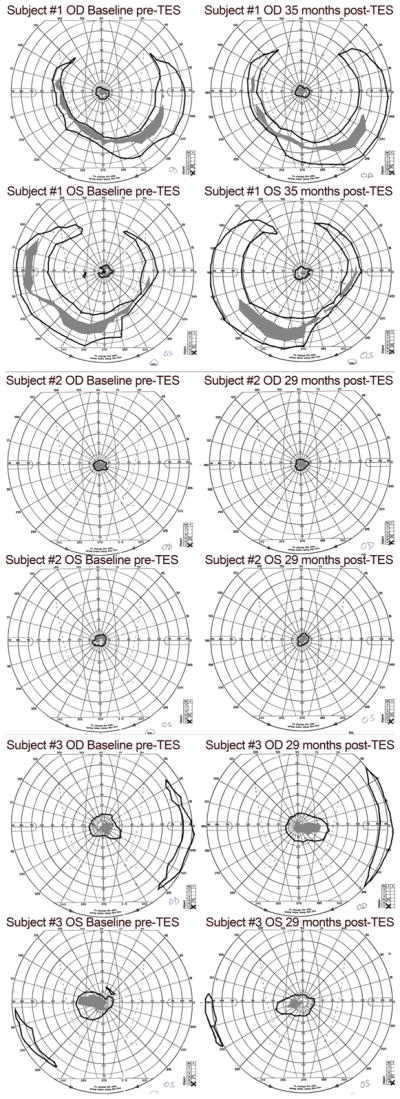
Fig. 3.

GVF maps of the plotted locations of vision in each eye of the three subjects at baseline (pre-TES)(shown in the left panels) and the last follow-up visit, 29–35 months post-TES (shown in the right panels). The V4e isopter is drawn with a black line and the III4e isopter is indicated by gray filled areas
