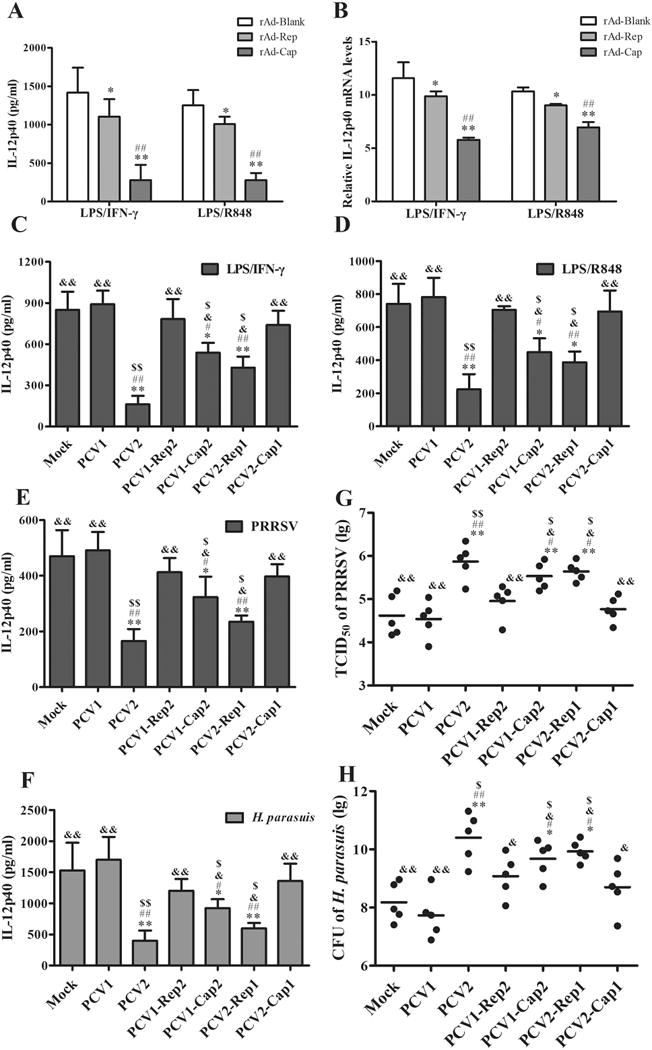
Figure 3. PCV2 Cap is the major component to suppress IL-12p40 expression in vivo.

(A, B) The PAMs were infected by 100 MOI of empty adenovirus (rAd-Blank), recombinant adenovirus expressing PCV2 Rep (rAd-Rep), or recombinant adenovirus expressing PCV2 Cap (rAd-Cap) for 24 h, respectively. Then the cells were stimulated by LPS/IFN-γ or LPS/R848, and the protein and mRNA levels of IL-12p40 were measured by ELISA and q-PCR. (C, D) The PAMs were infected by mock, PCV1, PCV2, PCV1-Rep2, PCV1-Cap2, PCV2-Rep1, or PCV2-Cap1 at 1 MOI for 24 h, then the cells were stimulated by LPS/IFN-γ or LPS/R848 for another 24 h. The IL-12p40 secretion were measured by ELISA. (E-H) piglets were infected with Mock, PCV1, PCV2, PCV1-Rep2, PCV1-Cap2, PCV2-Rep1, or PCV2-Cap1 at 4×10⁵ TCID50 for 1 week, then the pigs were further infected by PRRSV or H. parasuis for 24 h. The serum IL-12p40 levels of the infected pigs and replication of PRRSV or H. parasuis were measured. (A, B) *P < 0.05, **P < 0.01 versus rAd-Blank infected cells. #P < 0.05, ##P < 0.01 versus rAd-Rep infected cells. (C - H) *P < 0.05, **P < 0.01 versus mock infection cells. #P < 0.05, ##P < 0.01 versus PCV1-infected cells. &P < 0.05, &&P < 0.01 versus PCV2-infected cells. $P < 0.05 versus PCV1-Rep2- or PCV2-Cap1-infected cells.
