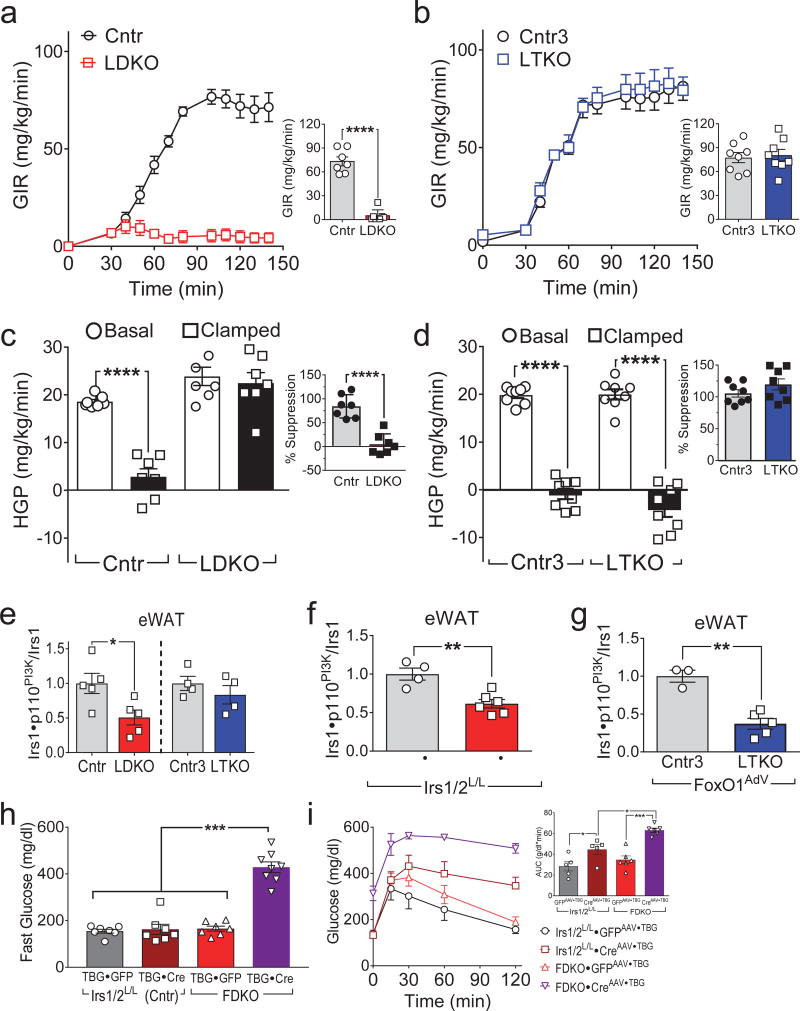
Figure 1.
Hepatic FoxO1 dysregulates WAT insulin signaling. (a,b) Glucose infusion rates (GIR) before and at steady-state (bar graphs) during hyperinsulinemic-euglycemic clamp of four-month old LDKO and Cntr mice (n = 7) (a), or LTKO and Cntr3 mice (n = 8) (b). (c,d) Hepatic glucose production (HGP) in LDKO and Cntr mice (n = 7) (c) or LTKO and Cntr3 mice (n = 8) (d) before and during the hyperinsulinemic-euglycemic clamp; inset shows the calculated suppression (%) of HGP by insulin. (e) Insulin-stimulated Irs1•p110PI3K complex formation in eWAT of four-month old LDKO, LTKO and control mice (n = 4–5). (f) Insulin-stimulated Irs1•p110PI3K complex formation in eWAT of three-month old Irs1L/L•Irs2L/L mice three weeks after injection with CreAAV•TBG or GFPAAV•TBG (n = 4–6). (g) Insulin-stimulated Irs1•p110PI3K complex formation in eWAT of eighteen-week old LTKO and Cntr3 mice two weeks after injection with FoxO1AdV (n = 3–5). (h) Fasting blood glucose levels in two-month old FDKO and Irs1L/L•Irs2L/L mice two weeks after injection with CreAAV•TBG or control GFPAAV•TBG (n = 7–8). (i) Glucose tolerance of FDKO and Irs1L/L•Irs2L/L mice two weeks after CreAAV•TBG or GFPAAV•TBG injection; inset, areas under glucose curves (n = 5–6). Data were analyzed by one-way ANOVA (c,d,e,h,i) and unpaired Student’s t-test (a,b,c,d,f,g). All data are presented as mean ± SEM. *P < 0.05; **P < 0.01; ***P < 0.001; ****P < 0.0001.

