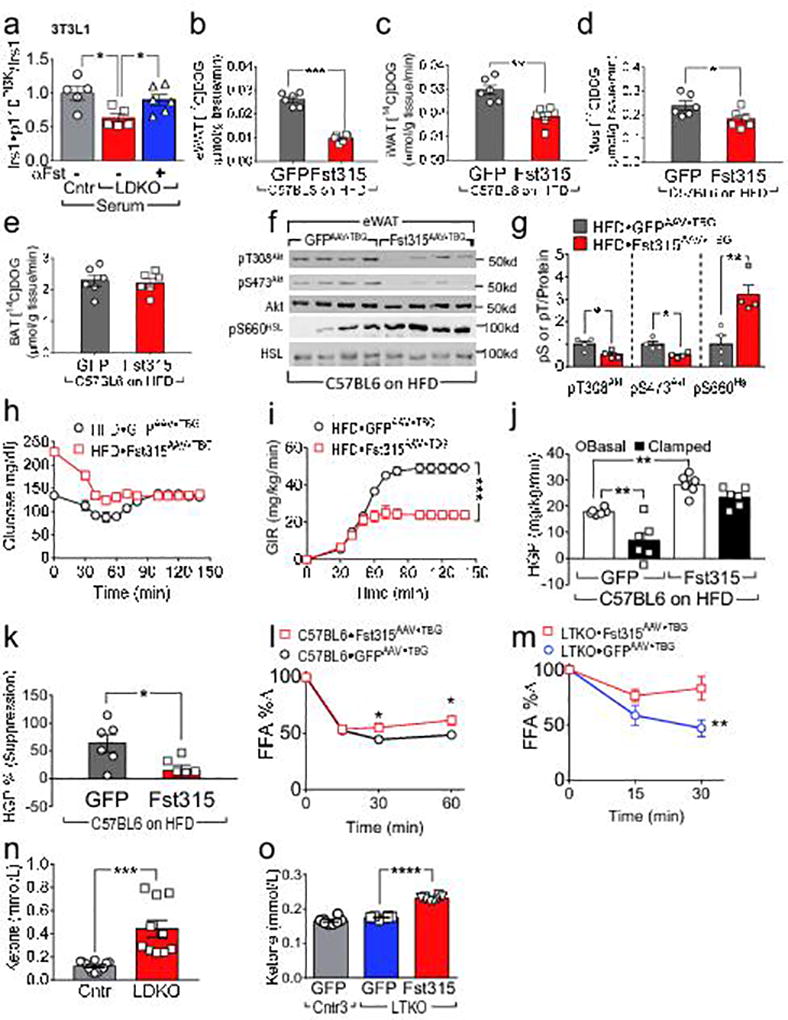
Figure 5. Fst315 promotes WAT insulin resistance, HGP, and glucose intolerance in WT mice.

(a) Insulin-stimulated Irs1•p110PI3K complex formation in 3T3-L1 adipocytes treated with serum from overnight-fasted four-month old LDKO (vs Cntr) mice, with or without the addition of Fst antibody (R&D, AF669, 10 µg/ml) (n = 5–6). Panels b–k: Five-week old C57BL6 mice were challenged with high fat diet for four months before infection with Fst315AAV•TBG or GFPAAV•TBG, and hyperinsulinemic-euglycemic clamps were performed four weeks later. (b–e) Uptake of 2DOG ([1-14C] 2-deoxy-D-glucose) tracer into eWAT (b), iWAT (c), skeletal muscle (d), and BAT (e), measured at the end of the clamp (n = 6). (f,g) Western blot analysis (f) and densitometric quantitation (g) of insulin-regulated Akt and HSL phosphorylation in eWAT upon completion of the clamp. (h,i) Blood glucose concentrations (h) and glucose infusion rates (i) before and during hyperinsulinemic-euglycemic clamp (n = 6). (j,k) Basal and clamped hepatic glucose production (j), and calculated suppression of HGP by insulin during the clamp (k) (n = 6). (l) Change in serum FFAs (% of overnight-fasted baseline) following insulin treatment (1 U/kg, i.p.) of 14-week old C57BL6 mice (maintained 10 weeks on high fat diet) two weeks after infection with Fst315AAV•TBG or GFPAAV•TBG (n = 10). (m) Change in serum FFAs (% of overnight-fasted baseline) following insulin treatment (1 U/kg, i.p.) of four-month old LTKO mice two weeks after infection with Fst315AAV•TBG or GFPAAV•TBG (n = 6–7). (n) Urinary ketones in four-month old LDKO and control mice after five hour fast (n = 10–12). (o) Urinary ketones (5 hours fasting) in four-month old LTKO and control mice two weeks after infection with GFPAAV•TBG or Fst315AAV•TBG (n = 8). Data in (a) were analyzed by ANOVA and compared by the FDR method of Benjamini and Hochberg (*q < 0.05); other data were analyzed by unpaired Student’s t-test (b–e,g,k,n), one-way ANOVA (j and o) and two-way ANOVA (i,l,m). Data are reported as the mean±SEM. *P<0.05; **P<0.01; ***P<0.001; ****P<0.0001.
