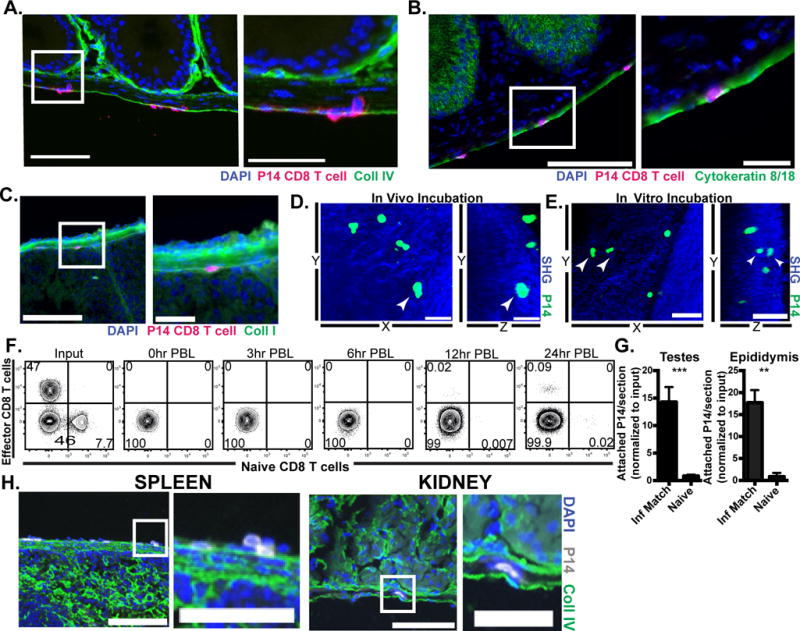
FIGURE 2. Evidence that effector CD8 T cells enter visceral tissues via direct transcapsular migration.

0.5-1×10⁶ CD45.1+ naïve P14 CD8 T cells and 3-4×10⁶ Thy1.1+ effector P14 from mice infected with LCMV 6 days prior (D6 effector) were mixed and co-transferred i.p. into day 6 LCMV infection-matched recipients. 3h after injection tissues were harvested and analyzed for migration of transferred cells. (A-C) Representative images of adhered and migrating effector P14 CD8 T cells (in magenta) on epididymis, DAPI (in blue) indicates nuclei. Part of the section on the left (white rectangle) is shown in higher magnification in the right. Scale bars=100μm (left panels) and 25μm (right panels). Sections were also stained for stromal markers (in green) including (A) collagen IV, (B) cytokeratin 8 and 18, and (C) collagen I. (D) 3-4×10⁶ LCMV D6 effector P14-gfp were i.p. transferred to infection-matched recipients. 3h after injection, the MGT was harvested and P14-gfp attachment was evaluated using 2-photon microscopy. Still images from 2-photon microscopy video show a P14 CD8 T cell (white arrowhead) under the collagen capsule layer, third dimension is flattened. Scale bar=30μm (left, in vivo panel). (E) 4×10⁶ D6 effector P14-gfp cells were incubated in vitro with infection-matched tissue for 1-3h before 2-photon microscopy. Still images from video with third dimension flattened show P14 cells (white arrowhead) under the collagen capsule layer, Scale bar=50μm. (F) Congenically marked D6 effector (11×106) and naïve (1.61×10⁶) P14 CD8 T cells were mixed and co-transferred i.p. into infection matched recipients. PBL was taken at indicated time points after injection. (G) D6 effector P14 were transferred i.p. into D6 LCMV infection matched or naïve recipients. 3h after injection, tissues were harvested and analyzed for attachment of transferred cells. (H) Representative images of D6 effector P14 cells adhered to spleen and kidney, scale bar=100μm(left) or 50μm (right). Graph shows mean and SEM, ***p<0.0001, **p 0.0012, Mann-Whitney test. n= at least 6 from 2-3 separate experiments.
