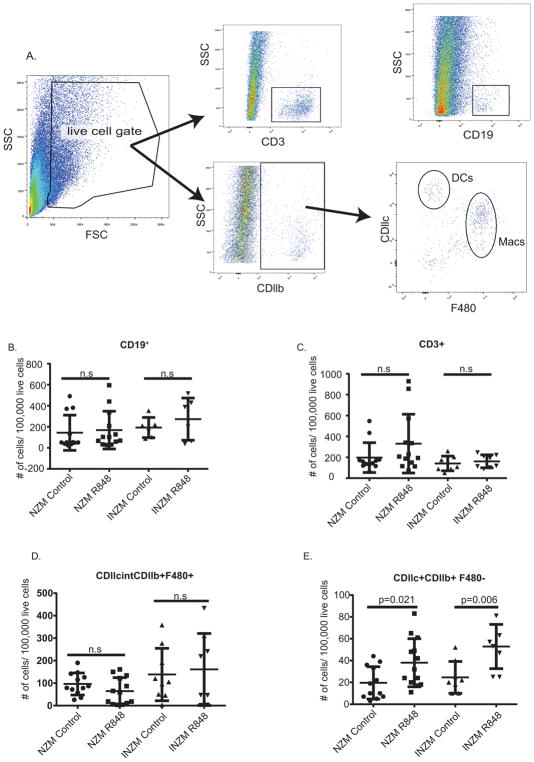
Figure 7. Early dendritic cell infiltration is a common feature of TLR7 driven nephritis in NZM and INZM mice.
Immune cell population changes in the kidney of NZM and INZM mice following 2 weeks of R848 or DMSO treatment. A. Gating strategy for immune cell populations. B–E. Graphs displaying changes in T cells (B): CD3+, B cells (C): CD19+, Macrophages (D): CDllcintCDllb+F480+, and Dendritic Cells (E): CDllc+CDllb+F480−. n=12 NZM DMSO; n=13 NZM R848; n=8 INZM DMSO; n=8 INZM R848. Data is displayed as mean ± SD.

