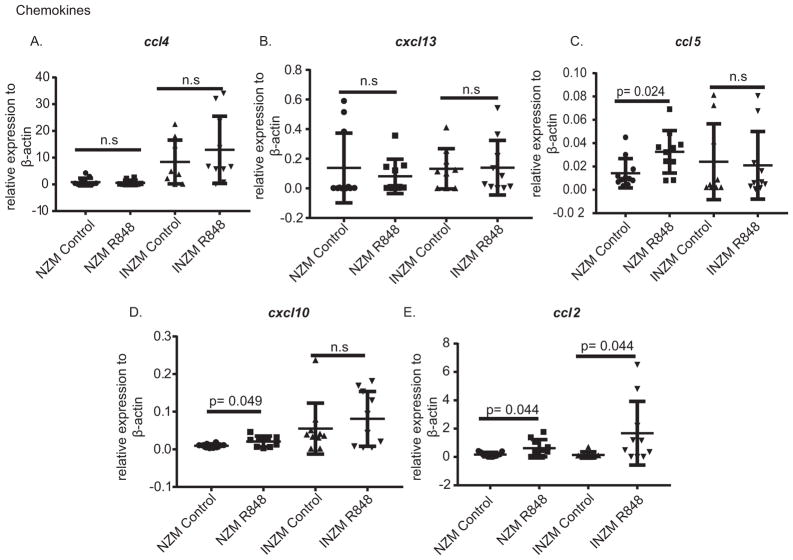
Figure 8. CCL2 is upregulated in NZM and INZM mice after TLR7 stimulation.
NZM and INZM mice were treated with R848 or DMSO for two weeks followed by harvest of RNA from the kidney. Real-time PCR was completed for the genes listed. Graphs display the mean ± SD for each gene as compared to the average of β-actin. Each dot represents a single mouse.

