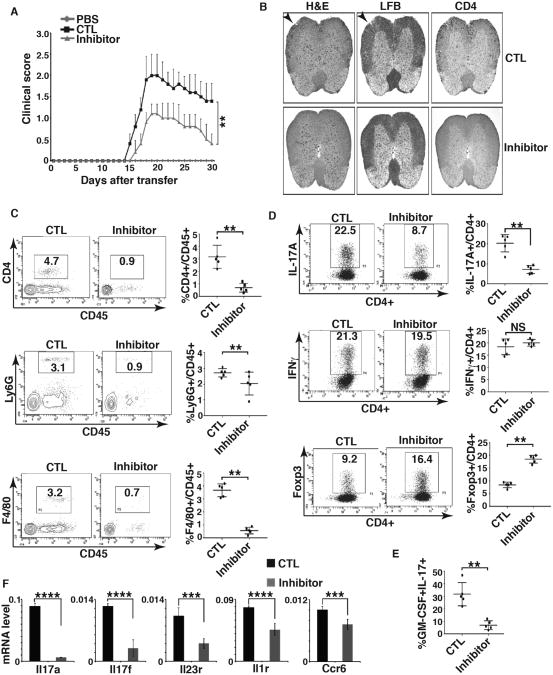
Figure 3. PRMT1 inhibitor prevents T cell-induced EAE.
A) Mean EAE clinical score of Rag1-/- mice adoptively transferred with PBS only, or CD4+ T expanded in the presence of MOG35-55 peptides and IL-23 (control, CTL) or together with PRMT1 inhibitor (inhibitor). B) H&E, LFB and CD4 staining of spinal cord transverse sections of CTL or inhibitor-treated mice as described in A at the peak of EAE. C) Percentage of different infiltrated lymphocytes in harvested CNS of indicated EAE-induced mice at the peak of disease, as determined by flow cytometric analysis of indicated surface markers. Right panels are the quantification results of the left panels. D) Percentage of IL-17A+ and IFNγ+ among infiltrated CD4+ T cells at the peak of disease and Foxp3+ cells at the recovery phase of the disease in harvested CNS of indicated EAE-induced mice, as determined by flow cytometric analysis of indicated molecules. Right panels are the quantification results of the left panels. E) Percentage of IL-17A+/GM-CSF3+ cells among infiltrated CD4+ T cells in harvested CNS of indicated EAE-induced mice at the peak of disease, as determined by flow cytometric analysis of indicated molecules. Right panel is the quantification results of the left panel. F) Expression of indicated Th17 signature genes among infiltrated lymphocytes of indicated EAE-induced mice at the peak of disease, as determined by qPCR. n=5 mice per group in each experiment. Error bars represent s.d. NS: non-significant. P< 0.05 and **P<0.01 (A, C, D, E, F, nonparametric Mann–Whitney U-test).

