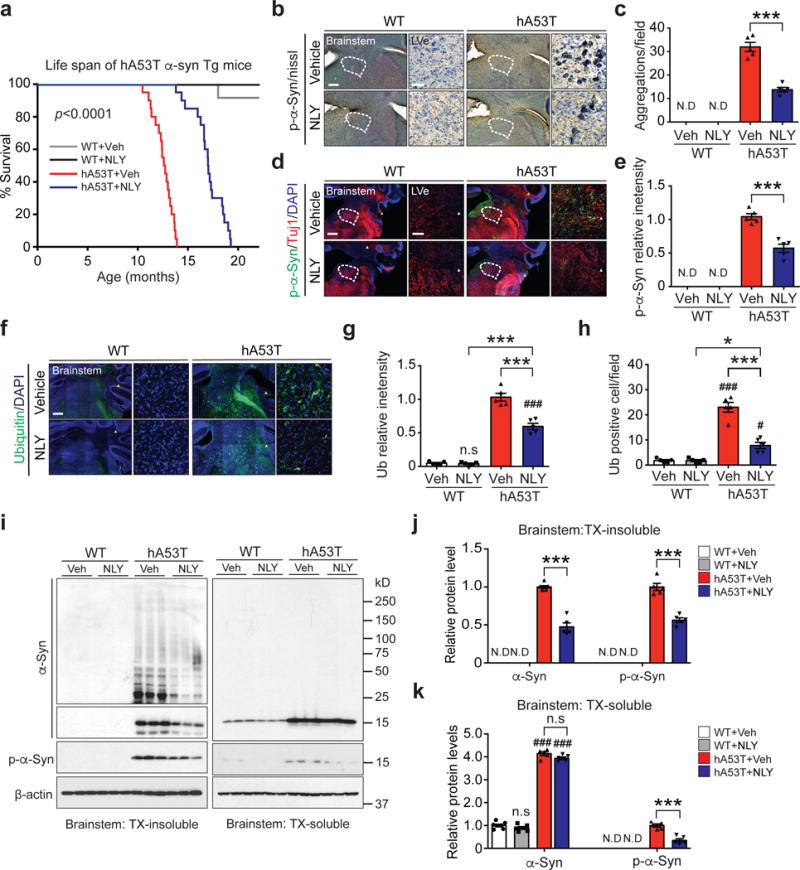
Figure 2.

NLY01 reduces the pathology in the hA53T α-syn transgenic mice. (a) Kaplan-Meier survival curves of littermate wild type (WT) and hA53T α-syn Tg mice treated with vehicle or NLY01 (3 mg/kg, n=20, biologically independent animals, p value < 0.0001). Statistical analysis for the survival curves were performed by Log-rank (Mantel-Cox) test. (b, d) Representative p-α-synser129 (p-α-syn) immunohistochemistry and immunostaining (red) in the lateral vestibular nucleus (LVe) of the brainstem (n=5, biologically independent animals). Low power images were generated by the tile scan algorithm in the Zen software. White arrow head (tile image line). Scale bar, 200 μm or 25 μm, respectively. (c, e) Quantification of LVe neurons containing p-α-synser129 positive-immunoreactivity inclusions. Error bars represent the mean ± S.E.M. (n=5, biologically independent animals, p value < 0.0001 for panel c and p value = 0.0003 for panel e). (f) Representative ubiquitin immunostaining (green) in the LVe (n=5, biologically independent animals). Scale bar, 200 μm or 25 μm. (g, h) Quantification of LVe neurons that are ubiquitin-positive. Error bars represent the mean ± S.E.M (n=5, biologically independent animals). (i) Representative immunoblots of α-syn, p-α-synser129 and β-actin in detergent (Triton-X100) insoluble fractions and detergent soluble fractions of the brainstem from ten-month-old WT and hA53T α-syn Tg mice treated with vehicle or NLY01 for four months (cropped blot images are shown, see Supplementary Fig. 21 for full immunoblots). (j) Quantification of α-syn monomer, aggregation, and p-α-synser129 protein levels in detergent insoluble fractions normalized to β-actin. Error bars represent the mean ± S.E.M. (n=5, biologically independent animals, p value < 0.0001). (k) Quantification of α-syn monomer and p-α-synser129 protein levels in detergent soluble fractions normalized to β-actin. Error bars represent the mean ± S.E.M. (n=5, biologically independent animals, α-syn, p value < 0.0001 and p-α-syn, p value = 0.0002). Unpaired two-tailed Student’s test or two-way ANOVA was used for statistical analysis followed by Tukey’s multiple comparisons test. #P < 0.05, ###P < 0.001 vs. WT with vehicle; *P < 0.05, ***P < 0.001 vs. hA53T α-syn Tg with NLY01.
