
Figure 3.
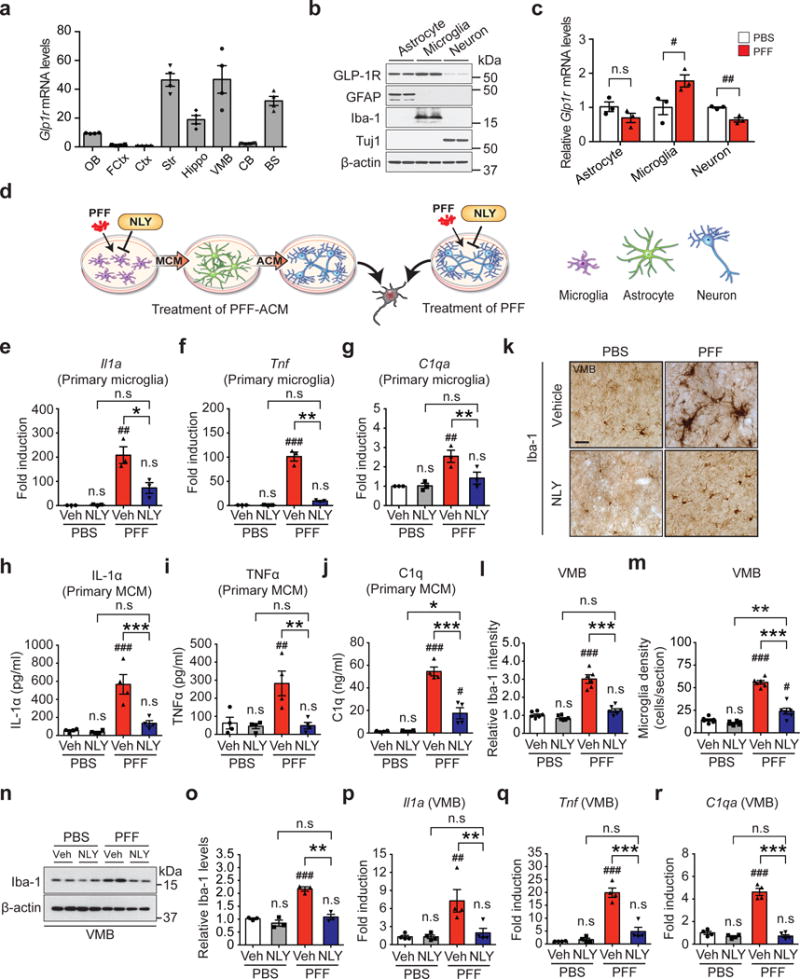
Inhibition of α-syn PFF-induced microglial activation by NLY01. (a) Glp1r mRNA expression was analyzed in various mouse brain regions. OB, olfactory bulb; FCtx, frontal cortex; Ctx, cerebral cortex; Str, striatum; Hippo, hippocampus; VMB, ventral midbrain; CB, cerebellum; BS, brainstem. Error bars represent the mean ± S.E.M. (n=4, biologically independent animals). (b) Predominant expression of GLP-1R in astrocytes and microglia. Mouse primary astrocytes (GFAP), microglia (Iba-1) and cortical neurons (Tuj1) were subjected to western blotting using GLP-1R antibody (cropped blot images are shown, see Supplementary Fig. 21 for full immunoblots). β-actin is provided as a loading control (n=3, biologically independent primary cells). (c) The Glp1r mRNA expression in α-syn PFF-activated primary cultured astrocyte, microglia, and neurons was analyzed by real-time RT-PCR. Bars represent the mean ± S.E.M. (n=3, biologically independent primary cells, primary microglia, p value = 0.0475 and primary cortical neuron, p value = 0.0045). (d) Schematic diagram showing treatment of α-syn PFF-astrocyte conditioned medium (ACM) or direct treatment of α-syn PFF into neurons. (e-g) Quantitative PCR analysis of NLY01 (1 μM) pretreatment on α-syn PFF-induced (1 μg/ml) microglial activation markers, (e) Il1a, (f), Tnfα, and (g) C1qa. Bars represent the mean ± S.E.M. (n=3, biologically independent primary microglia). (h-j) Cytokine analysis of α-syn PFF-activated microglia-conditioned medium (MCM) 18 hrs after α-syn PFF treatment by ELISA. NLY01 (1 μM) pretreatment prevented the increase of (h) IL-1α, (i) TNFα, and (j) C1q. Bars represent the mean ± S.E.M. (n=4, biologically independent primary microglia-conditioned medium). (k-m) Inhibition of α-syn PFF-induced microglial activation by NLY01 in vivo. (k) Representative immunohistochemical images of Iba-1. Scale bar, 50 μm. (l) Intensity of Iba-1 positive signals in the SNpc, (m) Quantification of Iba-1 positive cell number in the SNpc. Bars represent the mean ± S.E.M. (n=6, biologically independent animals). (n) Representative immunoblots of Iba-1 and β-actin in the ventral midbrain of PBS and α-syn PFF injected mice treated with vehicle or NLY01 (cropped blot images are shown, see Supplementary Fig. 21 for full immunoblots). (o) Quantification of Iba-1 levels in ventral midbrain normalized to β-actin. Bars represent the mean ± S.E.M. (n=3, biologically independent animals). (p-r) Quantitative PCR for (p) Il1a (q) Tnfα, and (r) C1qa in the ventral midbrain of α-syn PFF injected mice. Bars represent the mean ± S.E.M. (n=4, biologically independent animals). Unpaired two-tailed Student’s test or two-way ANOVA was used for statistical analysis followed by Tukey’s multiple comparisons test. #P < 0.05, ##P < 0.01, ###P < 0.001 vs. PBS with vehicle; *P < 0.05, **P < 0.01, ***P < 0.001 vs. or α-syn PFF with NLY01.