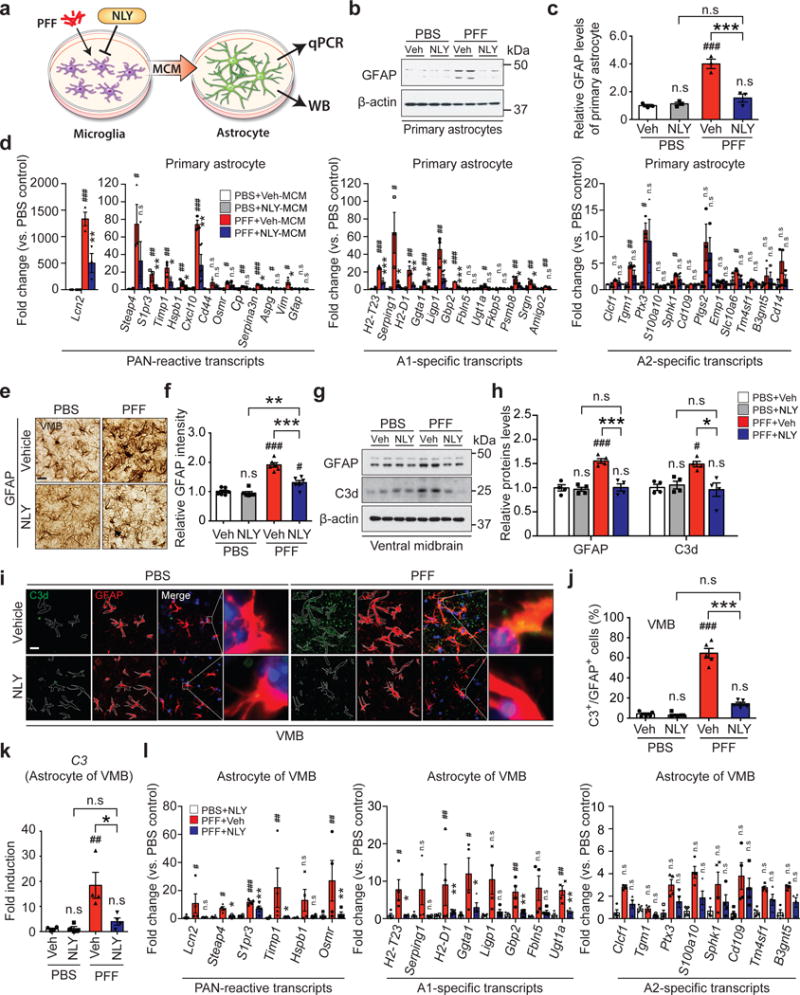
Figure 4.

Inhibition of α-syn PFF-induced A1 reactive astrocytes by NLY01. (a) Schematic diagram showing the collection of astrocyte samples after treatment with MCM of α-syn PFF with or without NLY01 treated microglia. (b) Representative immunoblots of GFAP in primary astrocytes treated with α-syn PFF-MCM with vehicle or NLY01 (1 μM) (cropped blot images are shown, see Supplementary Fig. 21 for full immunoblots). (c) Quantification of GFAP levels. Bars represent the mean ± S.E.M. (n=3, biologically independent primary astrocytes). (d) Inhibition of α-syn PFF-induced A1 reactive astrocytes by NLY01 in purified primary astrocytes. Bars represent the mean ± S.E.M. (n=3, biologically independent primary astrocytes). (e, f) Inhibition of α-syn PFF-induced A1 reactive astrocytes by NLY01 in vivo. (e) Representative images of immunohistochemistry and (f) quantification of GFAP. Bars represent the mean ± S.E.M. (n=6, biologically independent animals). Scale bar, 50 μm. (g) Representative immunoblots of GFAP in the ventral midbrain region (cropped blot images are shown, see Supplementary Fig. 21 for full immunoblots). (h) Quantification of GFAP levels. Bars represent the mean ± S.E.M (n=4, biologically independent animals). (i) Co-localization of C3d and GFAP as assessed by confocal microscopy. Scale bar, 10 μm. (j) Percentage of GFAP positive cells that are C3d positive in the SNpc region. Bars represent the mean ± S.E.M. (n=5, biologically independent animals). (k) Increase in expression of C3 transcripts, which is prevented by NLY01 treatment in α-syn PFF injected mice. Bars represent the mean ± S.E.M. (n=4, biologically independent animals). (l) Quantitative PCR analysis of purified astrocytes from the ventral midbrain of α-syn PFF injected mice with vehicle or NLY01. Bars represent the mean ± S.E.M. (n=4, biologically independent animals). Two-way ANOVA was used for statistical analysis followed by Tukey’s multiple comparisons test. #P < 0.05, ##P < 0.01, ###P < 0.001 vs. PBS with vehicle; *P < 0.05, **P < 0.01, ***P < 0.001 vs. α-syn PFF with NLY01 or with Veh. n.s, not significant.
