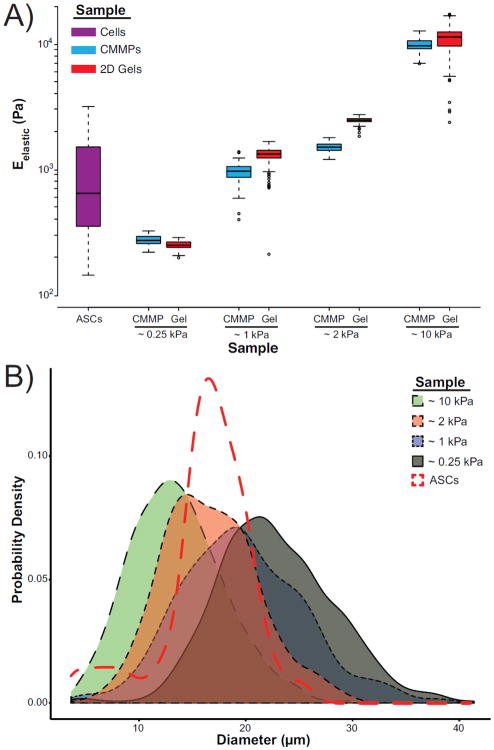
Figure 1. ASC, CMMP, and thin gel characterization.
(A) Box and whisker plots represent the distribution of Eelastic for human ASCs (purple) as well as the four CMMP formulations (blue) and their paired, thin gels (red). The three most compliant CMMP formulations fall within the ASC range while the final formulation is approximately an order of magnitude stiffer than the cells. (B) Probability density plots illustrate the distribution of microparticle diameters for each polyacrylamide formulation: ~0.25 kPa (grey), ~1 kPa (blue), ~2 kPa (red), and ~10 kPa (green). The size distributions of all populations overlap the typical size of mammalian cells (5–50 μm). The probability density plot of the ASCs used in this study is illustrated by the red dotted line.

