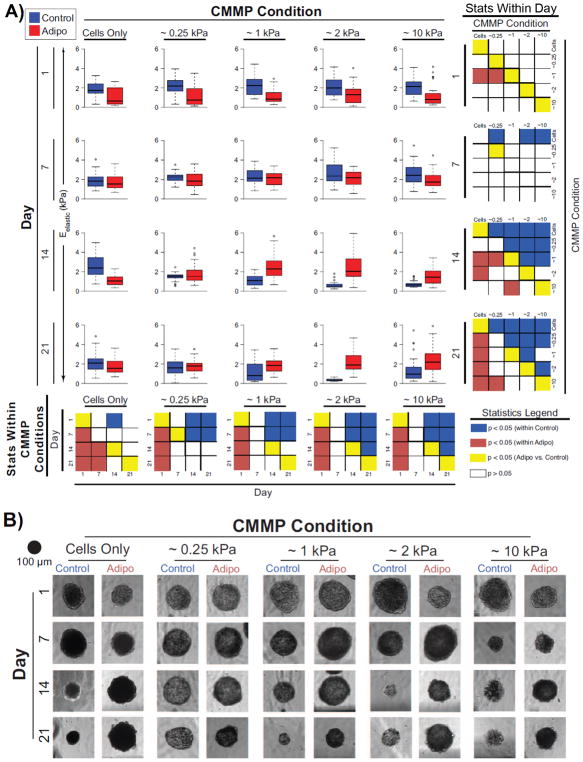
Figure 2. Temporal changes in composite spheroid elasticities and heights.
(A) Box plots of adipogenic (red) and control (blue) spheroid elastic moduli, Eelastic, and (B) matched, representative, bright field images are displayed in a matrix where descending rows illustrate later time points and columns represent increasing stiffness of incorporated CMMPs from left to right. For box plots, the blue (control) and red (adipogenic) colored regions represent the 25–75% quartile ranges, the central black line represents the median of the data, and the whiskers represent the data with outliers (circles) removed. The smaller matrices at the end of each row and column depict the statistical comparisons using raw p-values across CMMP conditions and day, respectively. Significant differences within either control or adipogenic groups are represented by blue and red boxes, respectively. Differences across media environments are denoted by yellow boxes, while comparisons that were not significantly different are represented by white boxes.

