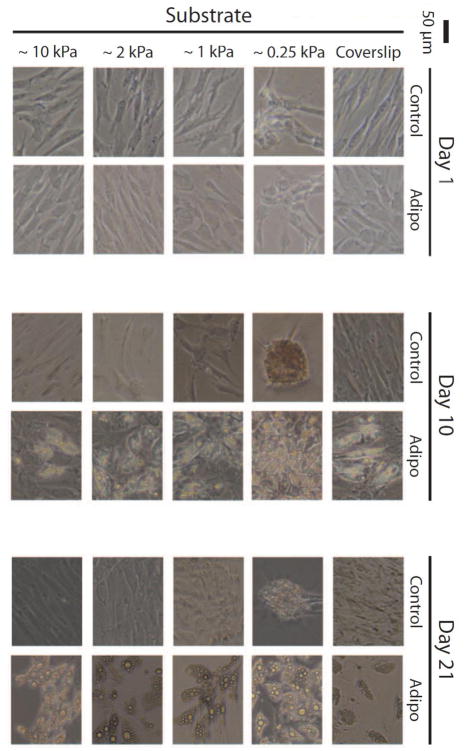
Figure 3. Two-dimensional imaging of ASCs on matched, compliant gels.
Phase contrast images depict ASCs after 1, 10, and 21 days in either control or adipogenic medium on coverslips or ~0.25, ~1, ~2, or ~10 kPa PAAm gels. Induced ASCs produced visible lipids after 10 days, with the most dramatic response occurring on the most compliant gel. After 21 days, lipids droplets increased in diameter with less noticeable differences among the substrates. Nodule formation was apparent for control ASCs on the most compliant gels.

