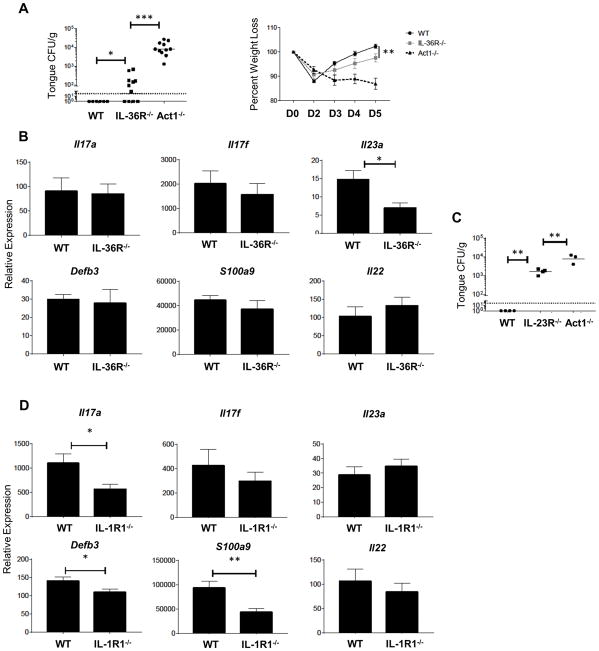
Figure 5. IL-36R−/− mice are susceptible to acute oral candidiasis.
(A) Indicated mice were orally infected with C. albicans. Oral fungal load (top) was assessed at day 5 p.i., bars represent geometric mean CFU, dashed line is the limit of detection. Weight loss (bottom) measured throughout the course of oral infection. Each group contains 3–5 mice from at least two independent experiments. (B) Relative mRNA expression of indicated genes in the tongue measured at 2 days p.i. Data are compiled from 3–5 mice per group from three independent experiments. Bars are mean + SEM, normalized to WT sham. (C) Oral fungal burden of indicated mice at day 5 p.i. Data for WT group compiled from historical controls. Bars represent the geometric mean, data from one experiment. (D) Relative mRNA expression of indicated genes analyzed at 2 days p.i. in WT and IL-1R1−/− mice. Data are compiled from 10 mice per group from two independent experiments. Bars are mean + SEM, normalized to WT sham. Data were analyzed by Student’s t test or ANOVA. *P < 0.05, **P < 0.01, and ***P < 0.001.

