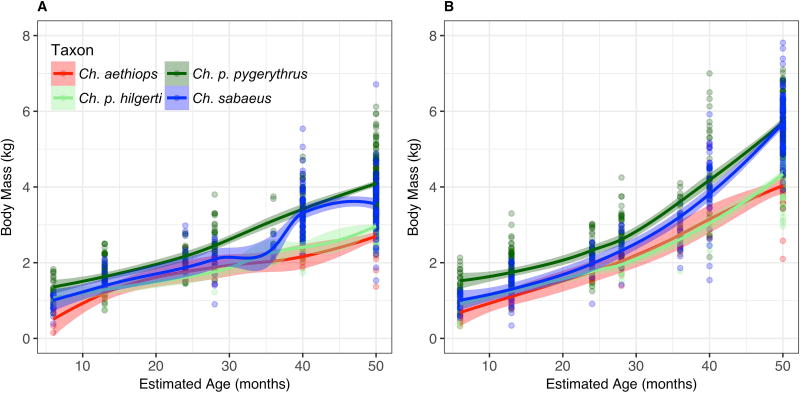
Fig. 2.
Loess models for changes in body mass (kg) by estimated chronological age in Chlorocebus a) females, and b) males with 95% confidence sheaths. Each cluster of points represents the midpoint of the interval of a single dental age category, from 1 to 6. Category 7, or ‘Adult’, includes adults in whom at least one third molar has erupted, and whose mean age is unknown. Their data points are therefore situated on the plot at 50 months, the start of this age interval, when the animal is at or close to adult size.

