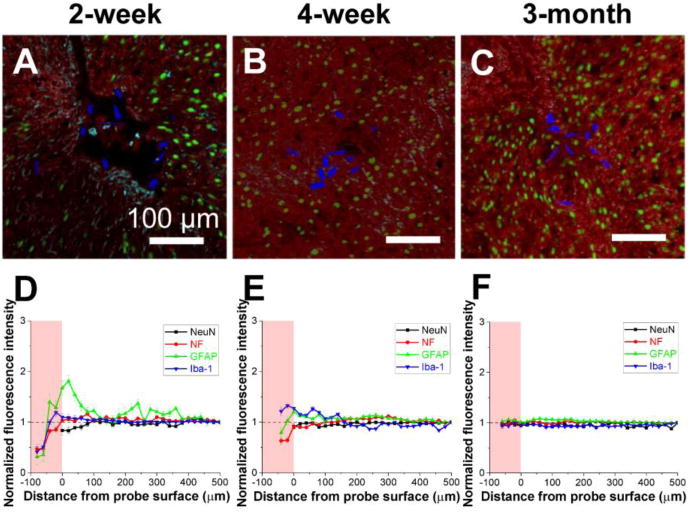
Figure 2.

Time-dependent histology of the mesh electronics/brain tissue interface. (A-C) Confocal fluorescence microscopy images of 10-μm thick horizontal brain slices sectioned perpendicular to the long axis of mesh probes at (A) 2, (B) 4 and (C) 12 weeks post-injection. Green, red, cyan and blue colors correspond to neuron nuclei (NeuN antibody), neuron axons (neurofilament antibody), astrocytes (glial fibrillary acidic protein, GFAP antibody) and mesh electronics, respectively. (D-F) Normalized fluorescence intensity plotted as a function of distance from the boundary of mesh electronics at (D) 2, (E) 4 and (F) 12 weeks post-injection. The pink shaded regions indicate the interior of the mesh electronics, and the error bars represent the standard error of the mean (s.e.m.). Reproduced with permission from ref. 30.
