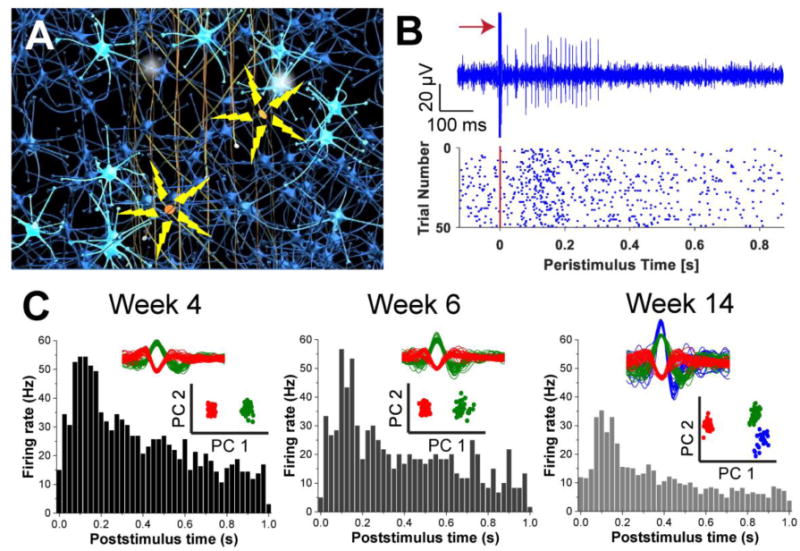
Figure 5.

Precision modulation of neural activity. (A) Schematic of mesh electronics with stimulation & recording electrodes where precise circuit modulation with simultaneous recording is highlighted from two stimulation sites. (B) A representative stimulus-evoked single-unit firing trace with a red arrow indicating the stimulus (top), and a raster plot showing single-unit firing events (blue dots) before and after an electrical stimulus is given (red solid line, t = 0 s) for 50 trials (bottom). (C) Poststimulus time histograms from a representative recording electrode in the vicinity of a stimulation electrode at 4, 6, and 14 weeks post-injection of the mesh probe. Spike-sorting and PCA clustering results with corresponding colors are shown as insets. Reproduced with permission from ref. 33.
