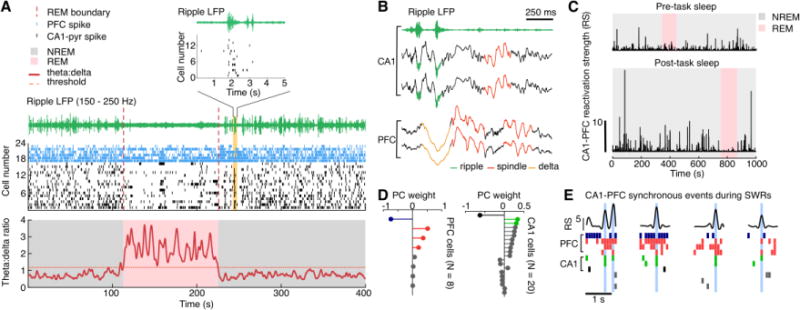
Figure 1. Hippocampal-prefrontal coordination during sleep SWRs.

(A) Distinct hippocampal-prefrontal activity patterns during NREM and REM sleep. Simultaneously recoded spiking activity from the hippocampal area CA1(black ticks) and PFC (blue ticks) is shown along with corresponding CA1 LFP traces (red line: theta-delta ratio; green line, ripple-filter LFP). REM sleep (red shading) is accompanied by enhanced theta (6-12 Hz) power (characterized by theta-delta ratio), and theta-modulated firing of CA1 pyramidal cells (horizontal stripes in the raster plot). In NREM sleep (grey shading), large-amplitude ripples (green line) were observed, coincident with population synchrony of CA1 spikes (note the vertical stripes in the raster plot). Top panel shows an expanded view of a representative CA1 synchronous reactivation event during sleep SWRs (orange shading).
(B) Hippocampal-prefrontal oscillatory coupling during NREM sleep. Example traces of simultaneously acquired LFPs from two CA1 (top) and two PFC tetrodes (bottom) in NREM stage are shown. Note that CA1 ripples (green) are closely followed by delta waves (1-4 Hz; orange) and spindles (12-18 Hz; red).
(C-E) Coordinated hippocampal-prefrontal reactivation during sleep SWRs. The coordinated reactivation of hippocampal-prefrontal ensembles can be measured using reactivation strength (Peyrache et al., 2009; Peyrache et al., 2010). This method uses principle components analysis (PCA) to detect neuronal ensembles, within which spiking activity is strongly co-activated among individual neurons of the ensemble during behavioral tasks. The contributions of single neurons to the co-activation are measured as their corresponding PC weights (D; color-coded to highlight neurons with high weights). The reactivation strength (RS) measures the correlation between the activity patterns during behavior characterized by PC weights and those during SWRs. If this synchronous activation of the detected ensembles during behavior is also strongly reactivated during sleep periods, the RS will have a high value. The RS of a representative CA1-PFC ensemble during sleep is shown in C. Notably, the RS is higher during post-task sleep (bottom) than pre-task sleep (top), suggesting enhanced reactivation after experience and learning. Also, the increase of RS during post-task sleep is prominent during NREM sleep (grey shadings), but not REM sleep (red shadings), suggesting stronger CA1-PFC reactivation in NREM stage. (E) The peaks of RS (top) represent synchronous events of CA1-PFC ensembles (bottom), which occurred predominantly during SWRs (same color code used in D).
Panels adapted from Tang et al. (2017).
