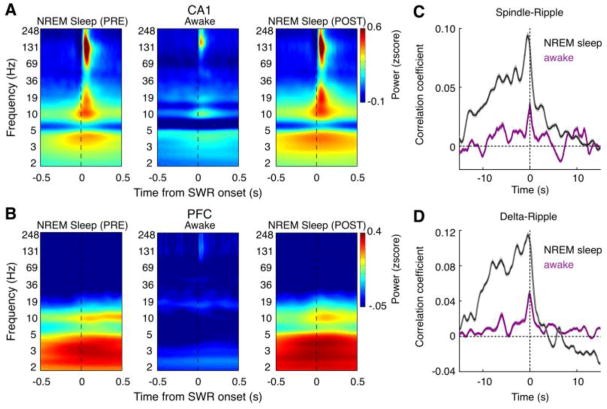
Figure 2. Hippocampal-prefrontal network oscillatory patterns differ during awake and sleep SWRs.

(A-B) SWR-triggered power spectrograms in CA1 (A) and PFC (B) during pre-task NREM sleep (left), wake (middle), and post-task NREM sleep (right). The spectrograms were Z-scored by the average power of each frequency in a given session. Note that there is enhanced delta (1-4 Hz) and spindle (12-18 Hz) power in the CA1 and PFC during sleep SWRs, but not during awake SWRs.
(C-D) Averaged cross-correlograms of CA1 ripple power versus PFC spindle (C) and delta (D) power. Note that there is stronger spindle-ripple and delta-ripple coupling during NREM sleep (purple) than waking (black). In addition, consistent with previous studies (Siapas and Wilson, 1998; Phillips et al., 2012), there is an asymmetry between positive and negative time lags in sleep correlograms, indicating an overall tendency for ripples to precede spindle-ripple/delta-ripple episodes.
Panels adapted from Tang et al. (2017).
