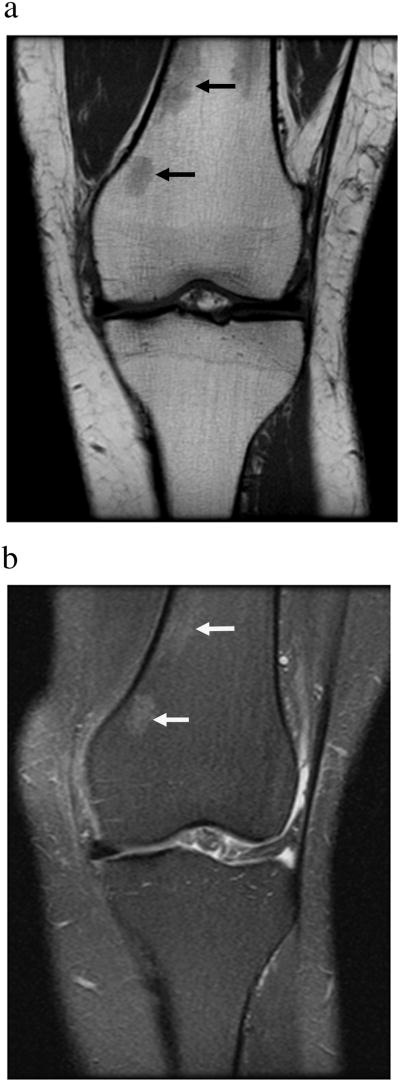
Figure 1.
Coronal T1-weighted (A) and coronal fat-suppressed T2-weighted (B) MR images of the knee demonstrate normal marrow adipose tissue which is hyperintense (bright) on T1- and hypointense (dark) on fat-suppressed T2-weighted images. Small islands of red marrow are of intermediate signal intensity (arrows).

