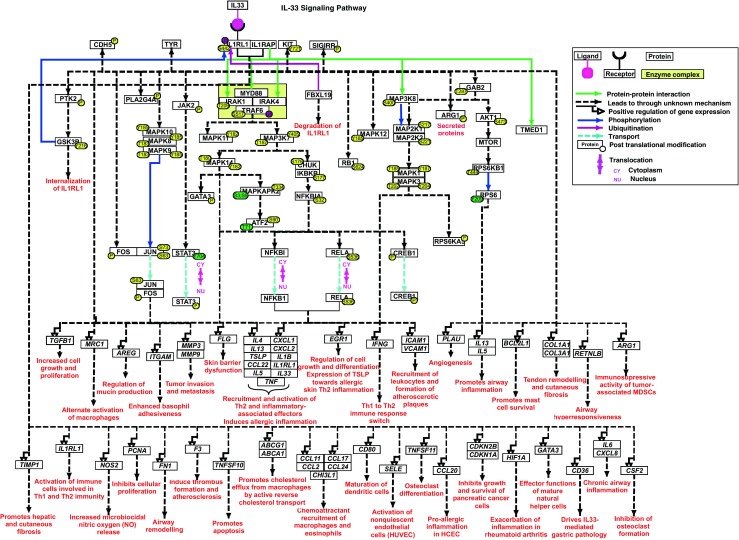
Fig. 1.

Schematic representation of IL-33 signaling. The pathway map represents ligand-receptor interactions and the downstream molecular events regulated by IL-33 including molecular association, catalysis, translocation and gene regulation events. These events are color coded as described in the pathway legend. Solid arrows indicate direct reactions and dashed arrows indicate reactions that occur through currently unknown mechanisms. Information pertaining to site and residue of post-translational modification are also included in the pathway map
