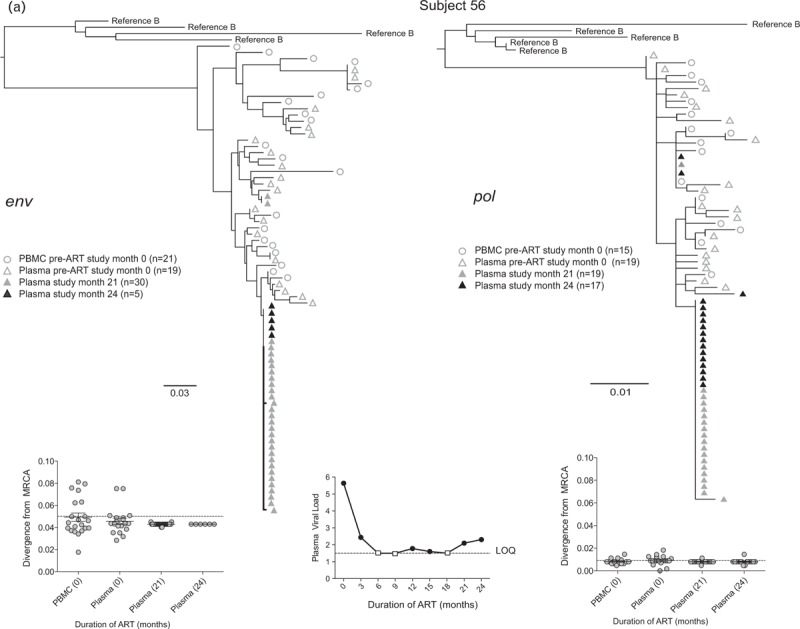
Fig. 2.
Representative phylogenetic trees, divergence, and plasma HIV RNA plots from four of 28 participants who had sequences generated from plasma low-level viremias (a–c) or viremias below the limit of quantification (d) (month specimens collected, in parenthesis).

LLV sequences from during ART (duration of ART in months) were analyzed with sequences from pre-ART (month 0) plasma and peripheral blood mononuclear cells (PBMC), with the number of sequences generated indicated in parentheses for each gene. Two patterns were observed in env and pol sequences from each LLV; a ‘monotypic’ pattern defined by more than 50% identical LLV sequences or a ‘diverse’ pattern defined by more than 50% genetically diverse LLV env sequences (Supplemental Figure 2). The more common monotypic pattern was seen in participant 1 (a), and suggests that an infected cell clone produced the virions. The diverse pattern seen in participant 2's (b) env sequences suggests virions come from multiple infected cells. The LLV env sequences diverged from the most recent common ancestor (MRCA) in only one participant in the study compared with their pre-ART specimens; this was participant 3 with monotypic X4 LLV sequences (c). Novel drug-resistance mutations were detected in the pol sequences of three participants (b and d), but drug-resistance and divergence in pol sequences were not detected together in any participants. Participant 4 (d) did not have LLV detected, but analysis of a plasma specimen with HIV RNA below the limit of quantification (BLLQ) found monotypic env and pol sequences and 6/6 monotypic pol sequences had V106A and were co-amplified with X4 env sequences. Her plasma HIV RNA remained target not detected (TND) for the remaining 15 months of the study. In the graphs displaying plasma HIV RNA loads, a small square indicates when the value was TND and is placed on the line drawn at the limit of quantification (LOQ) (1.48 log10 or 30 copies/ml), and if BLLQ, this is noted below the square. Sequences were rooted using representative sequences from GenBank (Clade B: B.US.83.RF, B.US.90.WEAU160, B.FR.83.HXB2, B.US.86.JRFL). The scale bar (horizontal line) indicates the number of substitutions per site. ‘Linked sequences,’ indicates that the env and pol sequences were co-amplified from the same reaction diluted to a single viral template. The env sequences predicted to use the CXCR4 co-receptor are enclosed in brackets labeled ‘X4’; all other sequences are predicted to use CCR5 co-receptor. LLV, low-level viremias; BLLQ, below the limit of quantification.
