
Figure 1.
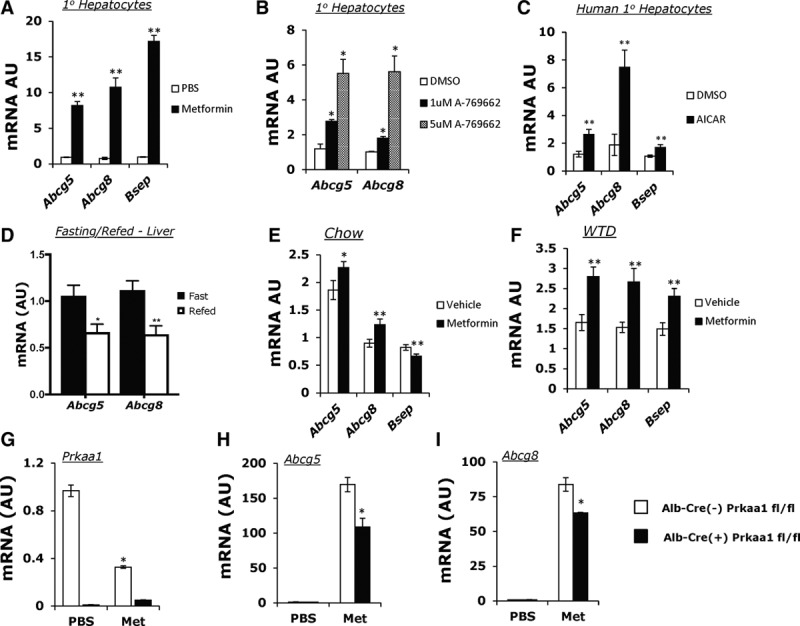
AMPK (5′ adenosine monophosphate-activated protein kinase) activation results in the upregulation of the liver cholesterol efflux genes, Abcg5/Abcg8 (ATP-binding cassette transporter G5/G8) in hepatocytes and liver. A, Real-time polymerase chain reaction (PCR) gene expression analysis of mouse primary hepatocytes treated with 0.5 mmol/L metformin for 20 hours in DMEM (0.2% FBS). B, Real-time PCR gene expression analysis of mouse primary hepatocytes treated with 2 doses, 1 and 5 μmol/L of A-7, an AMPK-specific agonist for 20 hours. C, Human primary hepatocytes treated with AICAR (5-aminoimidazole-4-carboxamide ribonucleotide; black bar; 0.5 μmol/L, 6 hours) or DMSO control (white bar). D, Abcg5 and Abcg8 expression in fasting (black bar) or refed (white bar) livers (n=4–5). E, Gene expression analysis of a fasting/refeeding protocol with a single 250 mg/kg metformin bolus during refeeding (n=15). F, Real-time PCR gene expression of the livers of mice fed a Western-type diet (WTD) for 3 months with a 2-week regiment of metformin (n=7; 250 mg/kg). F–H, Real-time quantitative PCR analysis of metformin treatment (0.5 μmol/L, 20 hours) in Alb-Cre(−)Prkaa1 fl/fl (white bar) and Alb-Cre(+) Prkaa1 fl/fl (black bar) primary hepatocytes looking at Prkaa1 (G), Abcg5 (H), and Abcg8 (I) expression. A, C, E, F, Data represents mean±SEM; *P<0.05, **P<0.01 using multiple t tests (FDR<0.05). B and D, Data represents n=3±SD; *P<0.05, **P<0.01 using unpaired Student t test. G–I, Data represents mean±SD; *P<0.05 using 2-way analysis of variance (ANOVA) with Tukey’s multiple comparisons test.