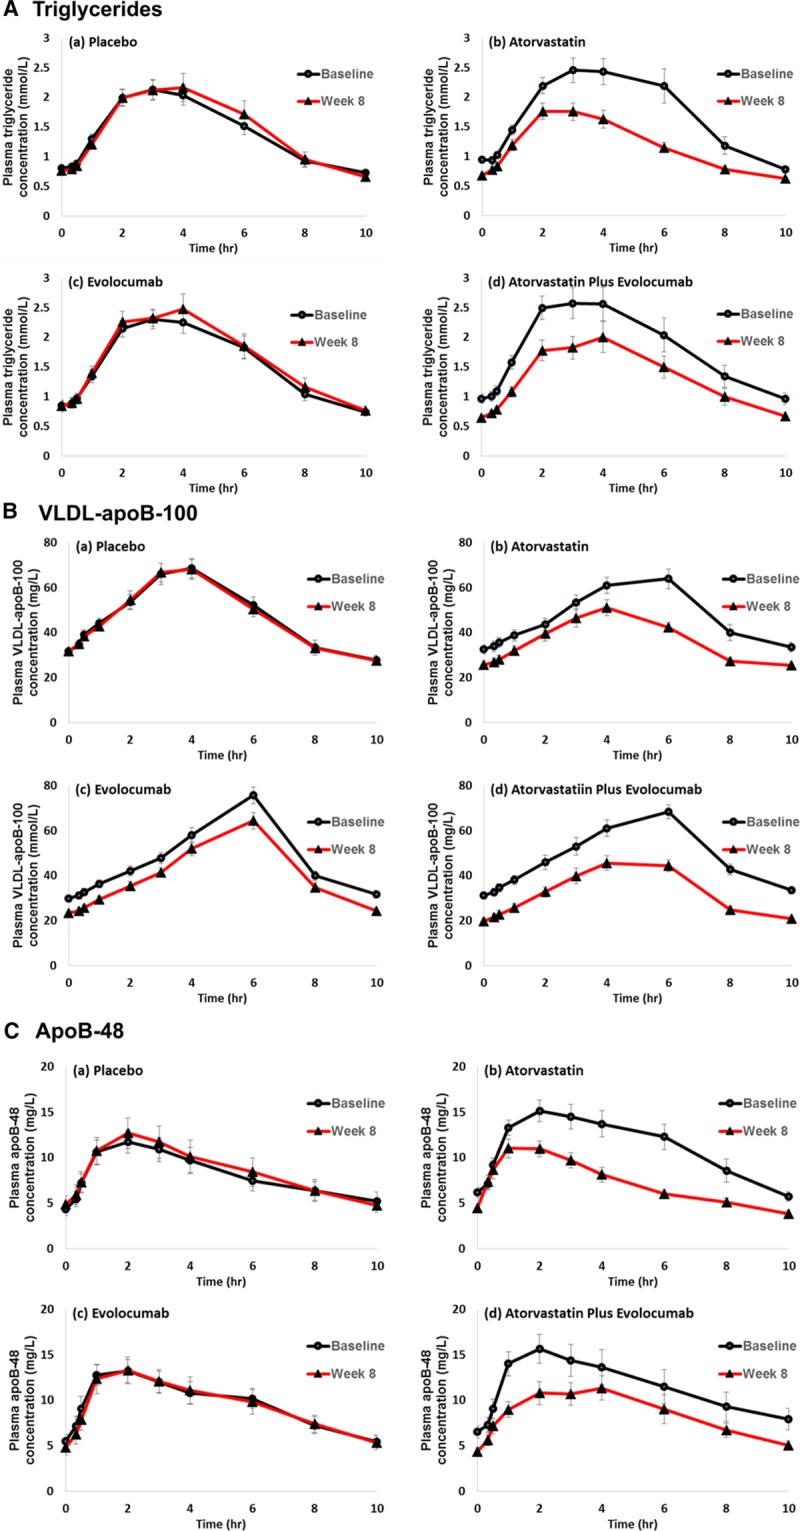
Figure 1.

Plasma triglyceride (A), VLDL-apoB-100 (B), and apoB-48 (C) responses to the fat load in the placebo, atorvastatin, evolocumab, and atorvastatin plus evolocumab groups. Values are expressed as mean±SEM. Apo indicates apolipoprotein; and VLDL, very-low-density lipoprotein.
