Fig. 1.
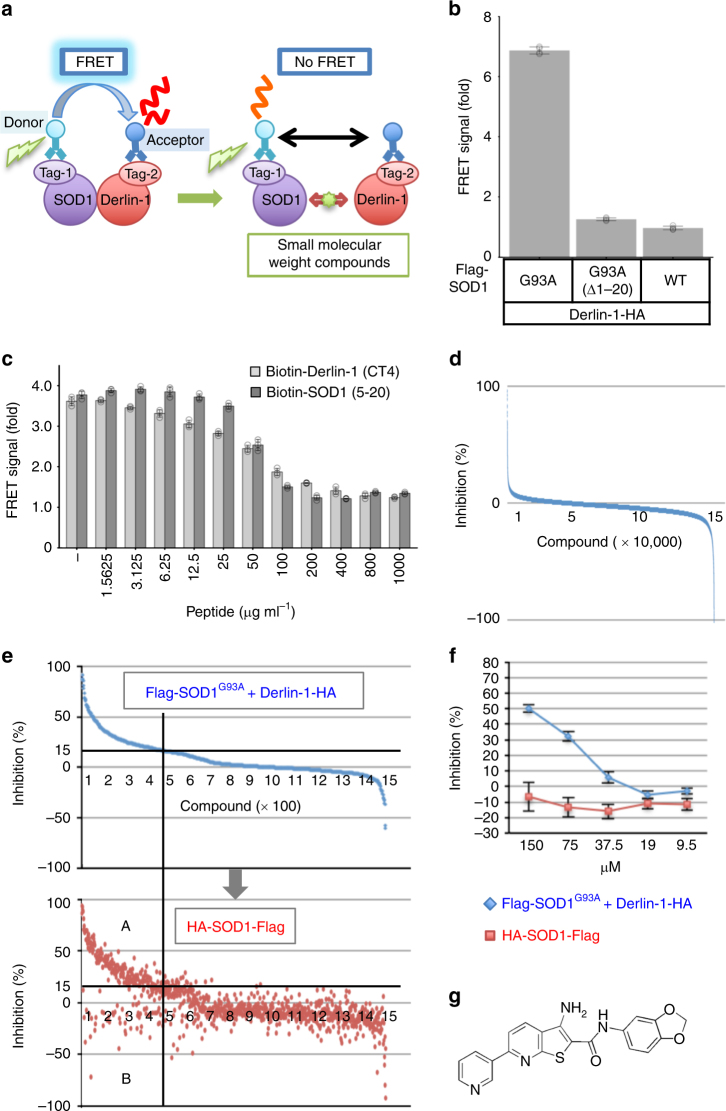
Screen of small molecules for SOD1-Derlin-1 interaction inhibitors. a TR-FRET-based interaction assay model showing the case of tagged SOD1 as a target of the Eu-labeled antibody and tagged Derlin-1 as a target of the d2-labeled antibody. b, c FRET signals with Flag-Eu and HA-d2 shown as fold changes from the FRET signal in non-transfected lysate. The data are shown as the mean ± s.d. b FRET signal using lysates from HEK293A cells transfected with plasmids as indicated (n = 4). c Competition assay of FRET signal generated by Flag-SOD1G93A and Derlin-1-HA using indicated concentration of SOD1 (5-20) and Derlin-1 (CT4) peptide. Lysates from HEK293A cells transfected with Flag-SOD1G93A and Derlin-1-HA were incubated with the indicated concentration of each peptide for 16 h (n = 3). Light gray: with Derlin-1 (CT4) peptide; dark gray: with SOD1 (5-20) peptide. d Result of the first screening. The compounds are presented in order of inhibition rate. e, f Blue: inhibition (%) against FRET signal generated by Flag-SOD1G93A and Derlin-1-HA; red: inhibition (%) against FRET signal generated by HA-SOD1WT-Flag. e Result of the second screening. The compounds are presented in order of inhibition rate against the SOD1-Derlin-1-derived FRET signal. f Result of #56 in the third screening. The data are shown as the mean ± s.d. (n = 4). g Chemical structure of #56

