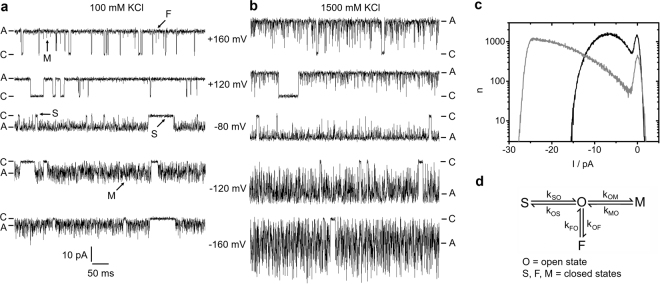
Figure 1.
Gating of KcvNTS. (a,b) Typical time series of current measured in symmetrical KCl solutions of (a) 100 mM and (b) 1500 mM. Closed “C” and apparent open level “A” are labelled. (c) Representative amplitude histograms in 100 (black) and 1500 mM KCl (grey), recorded at −120 mV. (d) Markov model of gating comprising one open state O, and three closed states (S = slow, M = medium, F = fast). The labels in (a) correspond to the states in (d).

