Figure 3.
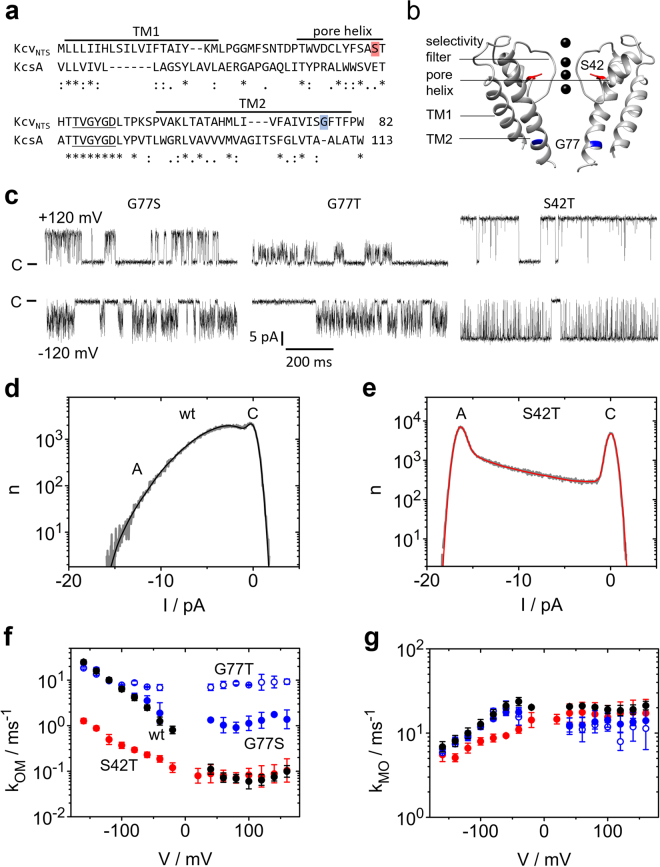
Mutational studies for the identification of the location of the two different processes found in O-M gating. (a) Sequence of KcvNTS as compared to KcsA. Asterisks indicate conserved residues, colons and periods strongly and weakly similar properties, respectively. (b) Structural model of KcvNTS constructed with Swissmodel79 with KirBac1.1 (PDB 1P7B54) as a template and drawn with UCSF Chimera80. The positions of mutations used in this study are indicated in red and blue, respectively. (c) Representative current traces of the mutants KcvNTS G77S, G77T, and S42T measured in symmetrical 100 mM KCl at −120 mV (top) and +120 mV (bottom). C labels the closed state. (d,e) Amplitude histograms (grey) of KcvNTS (d) and KcvNTS S42T (e) at −160 mV. The fit by the model in Fig. 1d with extended beta distributions44 is given in black or red. (f,g) Voltage dependence of the rate constants (f) kOM and (g) kMO of KcvNTS wt (black), KcvNTS S42T (red), KcvNTS G77S (blue) and G77T (blue open symbols). For comparison, the rate constants for KcvNTS wt and NTS G77S in (f) and (g) have been taken from a previous publication14. Numbers of experiments = 3 (6 for KcvNTS wt). If the standard deviations are smaller than the data points they are less than 25% scatter. All currents were recorded in symmetrical 100 mM KCl.

