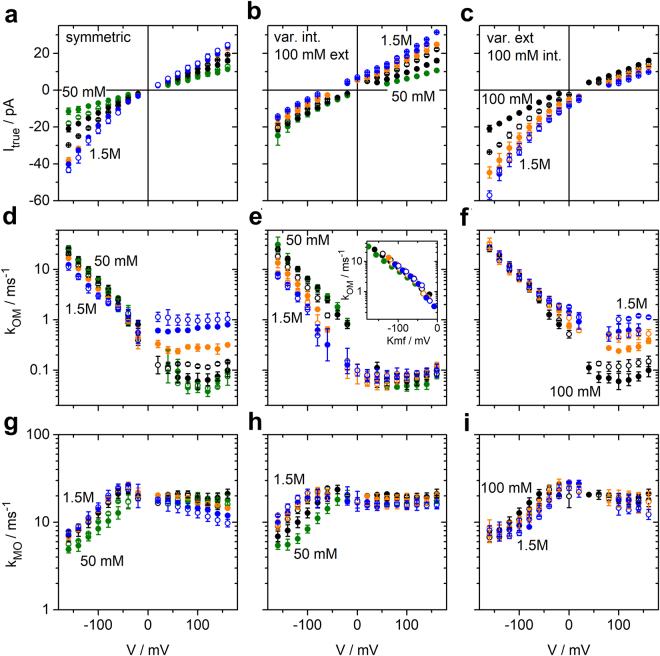
Figure 4.
Results of fitting ca. 1000 amplitude histograms from KcvNTS like those in Figs 1c and 3d from recordings in symmetrical and asymmetrical KCl solutions. Voltage and concentration dependence of those three parameters are shown, which describe the O-M gating: (a,b,c) current Itrue, (d,e,f) rate constant kOM of channel closure, and (g,h,i) rate constant kMO of channel opening. (a,d,g) Effect of symmetrical KCl concentrations ranging from 50 to 1500 mM. (b,e,h) Effect of internal K+: The external concentration was constant = 100 mM and internal concentration was varied. (c,f,i) Effect of external K+: internal KCl concentration was constant = 100 mM and external concentration was varied. 50 mM and 75 mM: green; 100 mM and 250 mM: black; 500 and 750 mM: orange; 1000 mM and 1500 mM: blue. The first concentration of a set of two with the same colour is given by closed circles, the second one by open circles. The inset in (e) shows the dependence on driving force Kmf = V − EK for internal K+ concentrations, indicated by the congruence of the curves when plotted over Kmf. Mean and standard deviations are obtained from 3–4 independent experiments for each concentration (6 for 100 mM symmetric KCl). If the error bars are hidden by the symbols, they are smaller than 25% for the rate constants and below 1 pA for the currents. The rate constants and Itrue for symmetrical 100 mM KCl, and the rate constants for symmetrical 1500 mM KCl have also been used in a previous publication14 to illustrate the extended beta distribution analysis.

