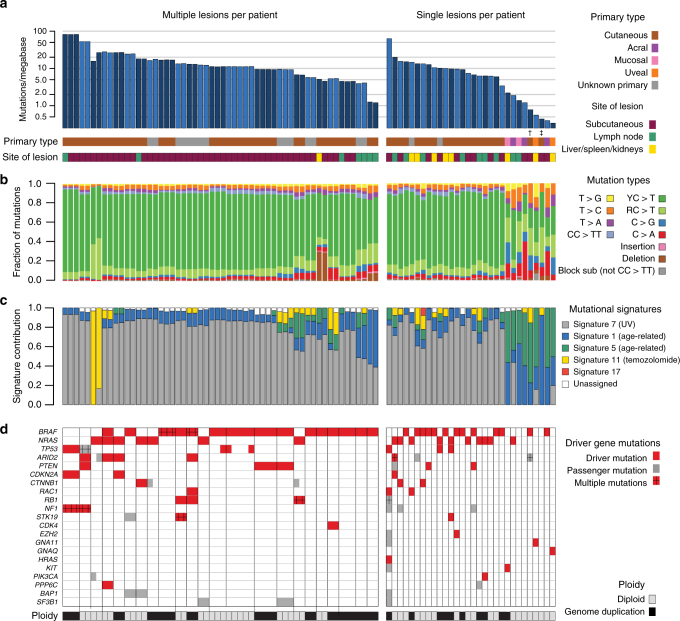
Fig. 1.
Overview of mutations. a–d Left: patients from whom multiple lesions were analyzed. Right: patients from whom single lesions were sampled. Patients are ordered by the number of mutations identified per patient, and lesions are further ordered according to time of sampling. a Number of mutations per megabase in each individual sample. Samples from different patients are indicated by alternating shades of blue. † One patient had a borderline acral primary tumor situated at a toe. ‡ One patient had a perianal cutaneous primary tumor, likely not exposed to UV radiation. b Fraction of mutation types per lesion. c Estimated contribution of mutational processes by fraction of mutations explained by each mutational signature26, according to the classification of Alexandrov et al.32. Only signatures explaining >5% of mutations are shown, and only signatures 7, 1, 5, 11, and 17 were assessed. d Mutations identified per lesion in established melanoma driver genes are color-coded: red boxes indicate driver mutations and gray boxes indicate passenger mutations. Multiple mutations per gene are indicated with ”+”. Genome duplication events are shown per sample in gray (diploid) or black (genome duplication) for each sample

