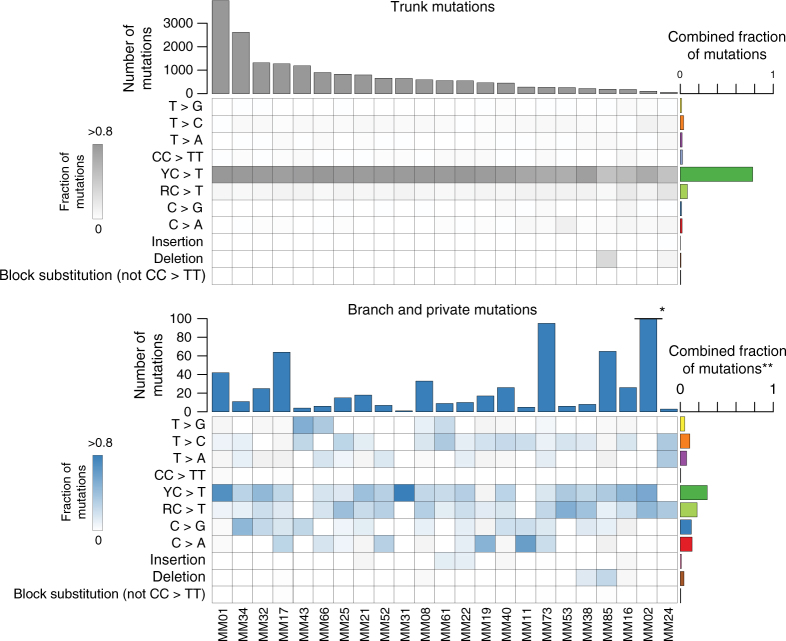
Fig. 3.
Comparison of trunk and branch mutations. Heatmaps show the relative frequency of mutations among branch mutations (top panel; gray) and branch mutations (bottom panel; blue) for each patient. C>T transitions are categorized as occurring downstream of pyrimidines (Y) or purines (R). The combined fractions of mutations represent the sum of mutations for each type relative to the total number of mutations for either trunk or branch mutations. * Due to the high number of branch mutations in MM02 (n = 1786), the bar is truncated for this patient. ** In the summary of branch mutation types, mutations in MM02 are omitted for clarity (branch mutations in MM02 displayed a particular mutational signature; see Supplementary Fig. 7 and 11 for details)

