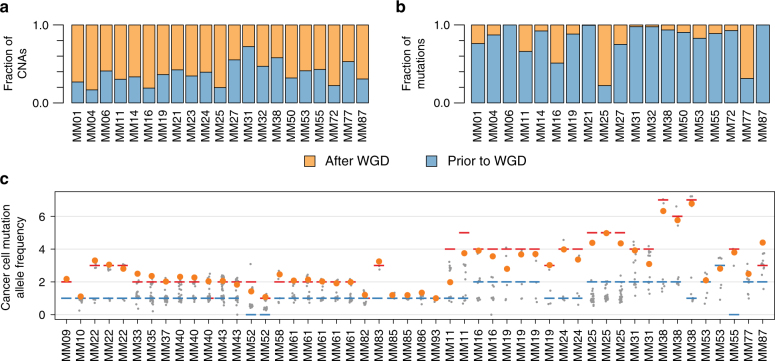
Fig. 5.
Timing of genome duplication and gain of mutated BRAF. a, b Estimated fraction of copy number events (a) and mutations (b) in assessable regions of the genome that occurred prior to and after genome duplication. c The relative allelic frequency (corrected to show allelic status of mutation) for mutations in the genomic segment harboring the BRAF gene in samples with a BRAF mutation. Allelic states are shown as red (major allele) and blue (minor allele) lines; mutations are shown as points, where the BRAF mutation is colored orange and all others are colored gray

