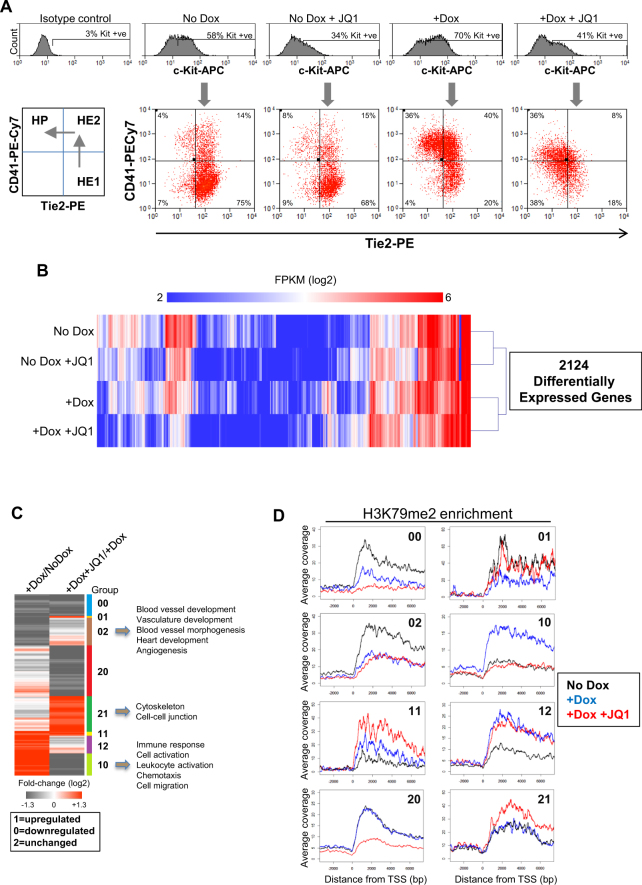
Figure 2.
Perturbation of the EHT by the bromodomain inhibitor JQ1. (A) Representative flow cytometry analysis from four independent experiments showing the effect of treatment with JQ1 on the differentiating cell populations. Adherent cells from each of the treatment conditions were stained with c-Kit-APC, CD41-PECy7 and Tie2-PE. Populations were gated on c-Kit positive cells (upper histogram) and cells within this gate expressing CD41 and Tie2 are shown in the quadrant plot below. The bottom left panel indicates the cell populations represented in each of the quadrants of cells stained with c-Kit-APC, CD41-PECy7 and Tie2-PE and also indicates the direction of differentiation. (B) Heatmap showing hierarchical clustering of log2 FPKM for the 2124 genes that change expression at least 2 fold between treatment conditions as defined in Supplementary Fig. 2B. (C) Changes in gene expression were grouped according to whether genes were up-regulated (1), down-regulated (0) or unchanged (2) between the indicated treatment conditions. The number of the group relates to changes between the +Dox compared to the No Dox sample (1st column) and changes between the +Dox +JQ1 compared to the +Dox sample (2nd column). GO terms for selected groups are indicated on the right hand side of the figure. See related Figure S2D for numbers of genes within each group. (D) Average profile of H3K79me2 enrichment for each of the 8 gene expression groups shown in Fig. 2C.

