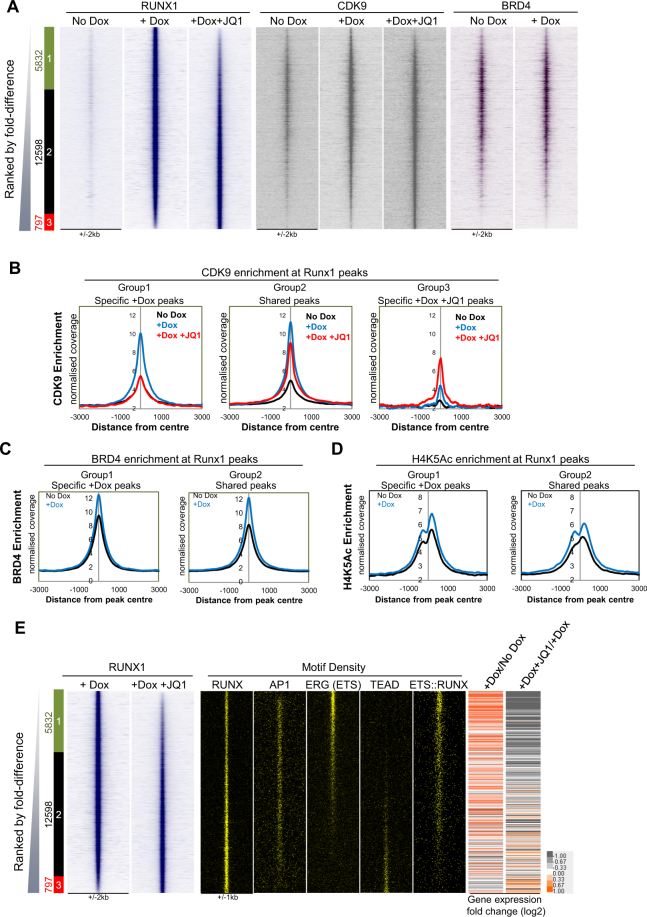
Figure 3.
Treatment with JQ1 inhibits RUNX1 binding and CDK9 recruitment to specific sites. (A) Heat maps showing ChIP-seq enrichment of RUNX1 binding for the No Dox, +Dox and +Dox +JQ1 samples, ranked according to fold difference between +Dox and +Dox +JQ1 samples. Peaks were considered to be specific if they showed greater than 2 fold enrichment in one sample compared to the other. The specific/shared groups and the numbers of peaks within these groups are shown alongside. Group 1 (green box) are +Dox-specific RUNX1 bound peaks; Group 2 (black box) are occupied by RUNX1 in both samples and Group 3 (red box) are +Dox +JQ1-specific RUNX1 bound peaks. Ranked along the same coordinates are heatmaps showing CDK9 enrichment for the No Dox and +Dox samples with and without JQ1 and BRD4 enrichment for the No Dox and +Dox samples. (B) Average profiles of CDK9 enrichment at the specific and shared RUNX1 bound sites for each of the different treatment conditions. The profiles were centred on RUNX1 peaks (+/−3000 bp from peak centre) and are shown for the specific and shared groups assigned in Fig. 3A. (C) Average profiles of BRD4 enrichment centred on RUNX1 peaks (+/−3000 bp from peak centre) in the shared and specific RUNX1 peaks from Fig. 3A. (D) Average profiles of H4K5Ac enrichment centred on RUNX1 peaks (+/−3000 bp from peak centre) in the shared and specific RUNX1 peaks from Fig. 3A. (E) Heat maps showing RUNX1 enrichment for the +Dox and +Dox +JQ1 samples (as shown in Fig. 3A). Shown alongside are motif density plots for the RUNX, AP1, ERG (ETS), TEAD and ETS::RUNX composite motifs. Also shown are heatmaps showing gene expression fold changes between +Dox compared to No Dox and +Dox +JQ1 compared to +Dox samples for the genes attributed to the corresponding RUNX1 ChIP-seq peaks.

