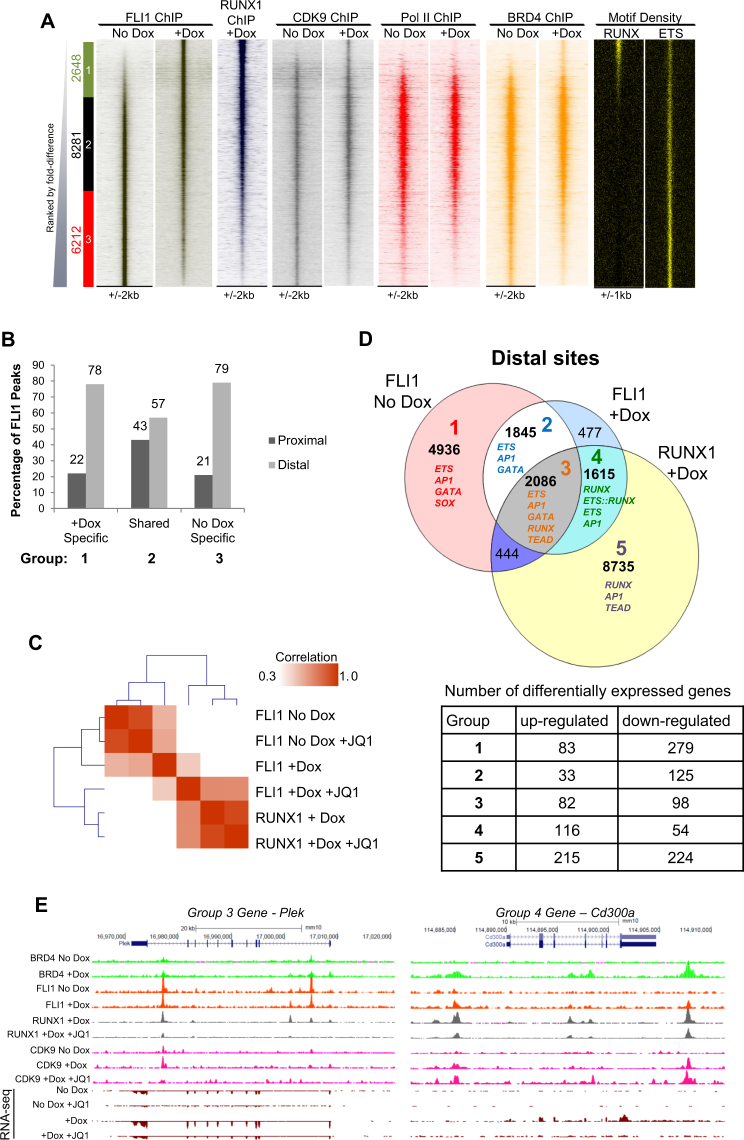
Figure 4.
Recruitment of CDK9 to distal sites by RUNX1 and FLI1. (A) Comparison of FLI1 binding in ChIP-seq from No Dox and +Dox treated samples ranked according to fold difference. Peaks were considered to be specific if they showed greater than 2 fold enrichment in one sample compared to the other and are designated as Group1, 2 or 3. The specific/shared groups and the numbers of peaks within these groups are shown alongside. Group 1 (green box) are +Dox-specific FLI1 bound peaks; Group 2 (black box) are occupied by FLI1 in both samples and Group 3 (red box) are No Dox-specific FLI1 bound peaks. RUNX1 binding in the +Dox treated samples, CDK9, BRD4 and Pol II ChIP-seq enrichment in the No Dox and +Dox samples and the RUNX and ETS motif density plots are ranked along the same coordinates. (B) Genomic distribution of FLI1 binding sites in the specific and shared sites for Fig. 4A. Percentages of proximal and distal sites are shown above the bars. (C) Clustering analysis based on the Pearson correlation for the RUNX1 and FLI1 ChIP-seq samples. (D) Venn diagram showing the peak overlap between FLI1 binding in the No Dox and +Dox samples and RUNX1 binding in the +Dox sample. Five groups are highlighted based on these overlaps and the diagram is annotated with the most highly represented TF motifs for each of the groups 1–5 and the number of peaks within each group. The table below shows the number of differentially expressed genes relating to each group. Differentially expressed genes are those which change expression more than 2 fold between the +Dox compared to the No Dox sample as shown in Supplementary Fig. S2B. (E) Genome browser screenshots depicting the indicated ChIP-seq tracks for Plek and cd300a as representative genes from Groups 3 and 4 respectively, from Fig. 4D.

